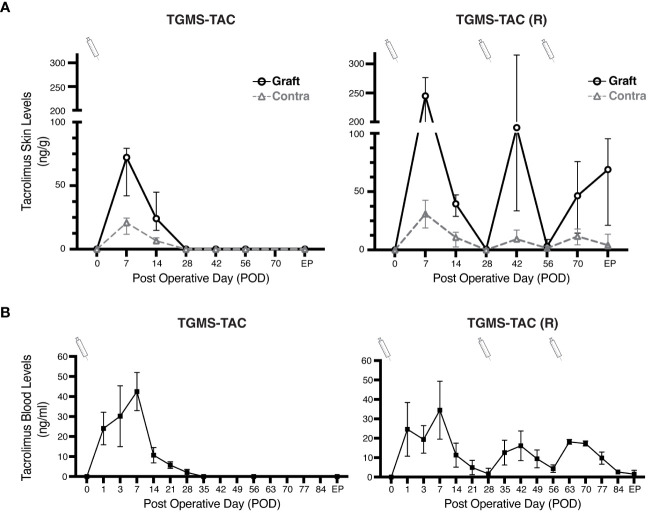
Figure 3.
Local TGMS-TAC injections result in higher concentrations of the drug in grafts. (A) Comparison of TAC tissue levels in grafts and contralateral side skin for both single administration of TGMS-TAC (left), and multiple administration TGMS-TAC (R) (right). TAC levels were measured in skin biopsies collected on different postoperative days (POD). Tissue concentrations are represented as ng of TAC per g of skin. (B) Whole-blood levels of tacrolimus in pigs from the TGMS-TAC and (TGMS-TAC (R) groups were measured at POD 0, 1, 3, and then on a weekly basis. Blood levels are expressed as ng/ml. TGMS-TAC injection time points are indicated with a syringe. TAC was measured in both skin and whole blood using LC-MS/MS. Data are represented as means ± SD of n=4 samples.

