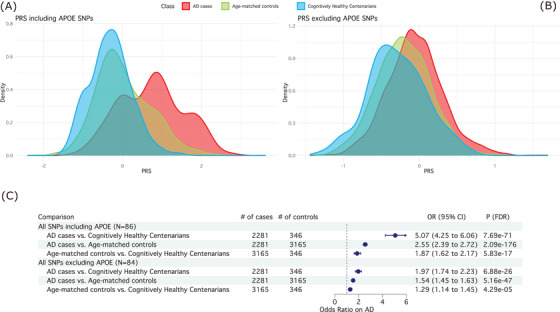
FIGURE 2.

Summary of PRS analyses. A (top left), Distribution of the PRS including the two APOE SNPs (86 SNPs in total) in AD cases (red), age‐matched controls (blue), and cognitively healthy centenarians (green). B (top right), Distribution of the PRS excluding the two APOE SNPs (84 SNPs in total). C (bottom), Association statistics (OR, 95% CI, and corrected P value) and forest plot of the PRS including and excluding APOE SNPs. For the comparisons, we used logistic regression models in a pairwise manner (i.e., AD cases vs. cognitively healthy centenarians, AD cases vs. age‐matched controls, and age‐matched controls vs. cognitively healthy centenarians), controlling for population substructure. AD, Alzheimer's disease; APOE, apolipoprotein E; CI, confidence interval; OR, odds ratio; PRS, polygenic risk score; SNP, single nucleotide polymorphism.
