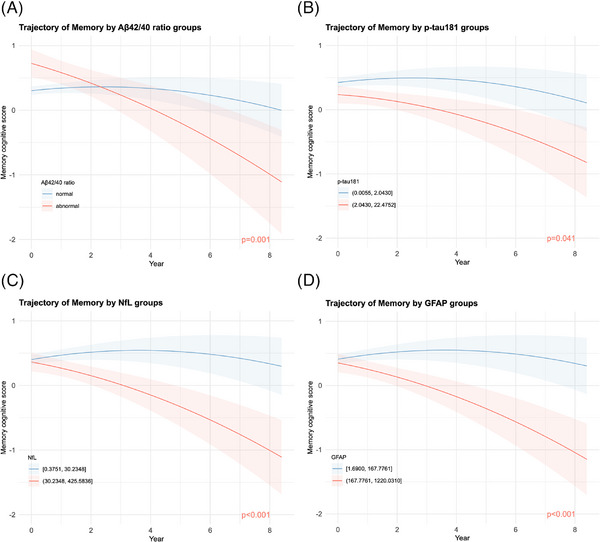
FIGURE 2.

Trajectories of memory composite scores by plasma biomarker values. Trajectory plots were generated to visualize the estimated average memory composite score over the follow‐up period, based on (A) Aβ42/Aβ40, (B) p‐tau181, (C) NfL, and (D) GFAP groups. These plots were derived from linear mixed‐effects submodels of the joint models, accounting for longitudinal memory composite scores and informative dropout. Each plasma biomarker was individually added to a basic random coefficients model with age, sex, race, education, and APOE allele as fixed effects and time as random effects. The shaded areas represent Bayesian 95% credible intervals. The annotated raw P value indicates the significance of differences in decline rates between the abnormal group (red) and the normal group (blue) in (A), or between the higher group (red) and the lower group (blue) in (B)‐(D). The Aβ42/40 abnormal group was defined as plasma Aβ42/40 > 0.1249, equivalent to exp(−2.08). The cutoff values for other plasma biomarkers were their 66.66th percentile (upper tertile) and are shown in the figure legends. Aβ, amyloid beta; APOE, apolipoprotein E; GFAP, glial fibrillary acidic protein; NfL, neurofilament light chain; p‐tau181, phosphorylated tau.
