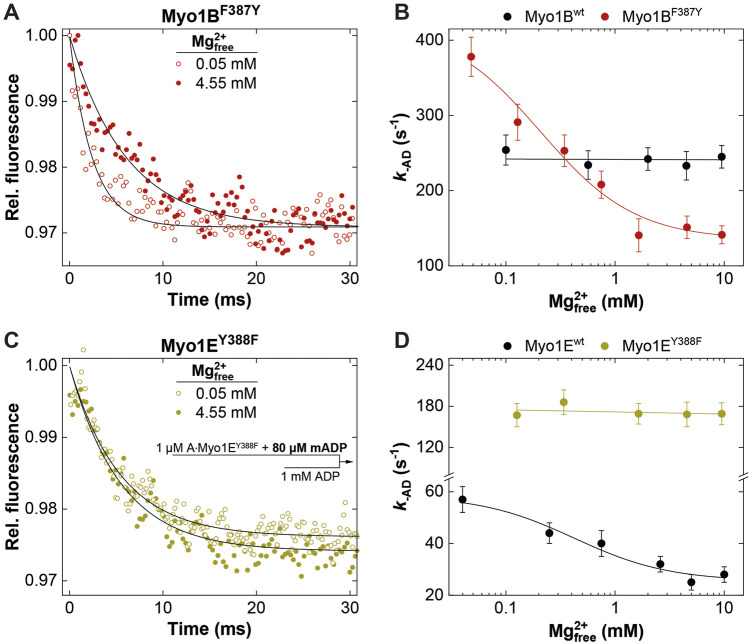
FIGURE 5.
Effect of [Mg2+]free on ADP release from actomyosin. Relative mantADP-fluorescence time traces as observed upon mixing 1 μM A∙Myo1BF387Y (A) or 1 μM A∙Myo1EY388F (C) pre-equilibrated with 80 µM mADP at 0.05 mM and 4.55 mM free Mg2+-concentrations, with excess ADP. Rate of ADP release ( k -AD ) from A∙Myo1Bwt and A∙Myo1BF388Y (B) and related Myo1E constructs (D) as a function of the free Mg2+-concentration as obtained from single exponential fits to the mantADP-fluorescence time traces.

