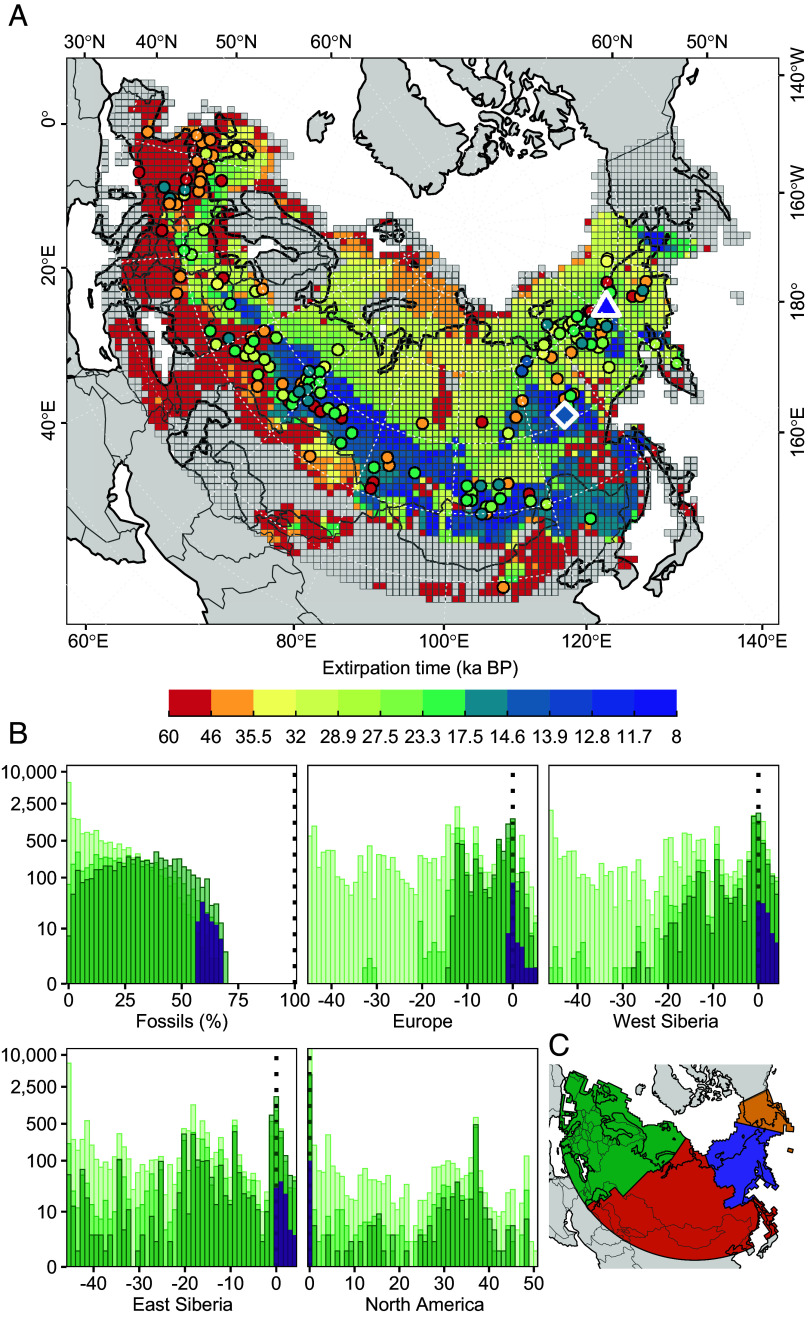
Fig. 1.
Timing of woolly rhinoceros extirpation across Eurasia. (A) Grid-cell colors on the map show simulated time of extirpation. Circles show fossil locations, with colors representing the youngest age estimate (mean age + 1 SD). The blue diamond shows the youngest radiocarbon dated woolly rhinoceros fossil. The purple triangle shows youngest estimate of occurrence from sedimentary ancient DNA (20). Gray cells were never occupied. (B) Histograms shows the ability of process-driven models to correctly project spatiotemporal occurrence at fossil sites, displayed as a percentage (Fossil %); estimate timing of regional extinction in Europe, West Siberia, and East Siberia, shown as difference in years (kyr); and period of occupancy in North America, also shown in years (kyr). Validation targets are displayed as dotted black lines. Purple colored bars show selected models. Green colored bars show all models; shades of green represent different rounds of pattern-oriented modeling, with lighter colors representing earlier rounds. Inset map (C) shows the regions: Europe (green), west Siberia (orange), east Siberia (purple), and North America (yellow).

