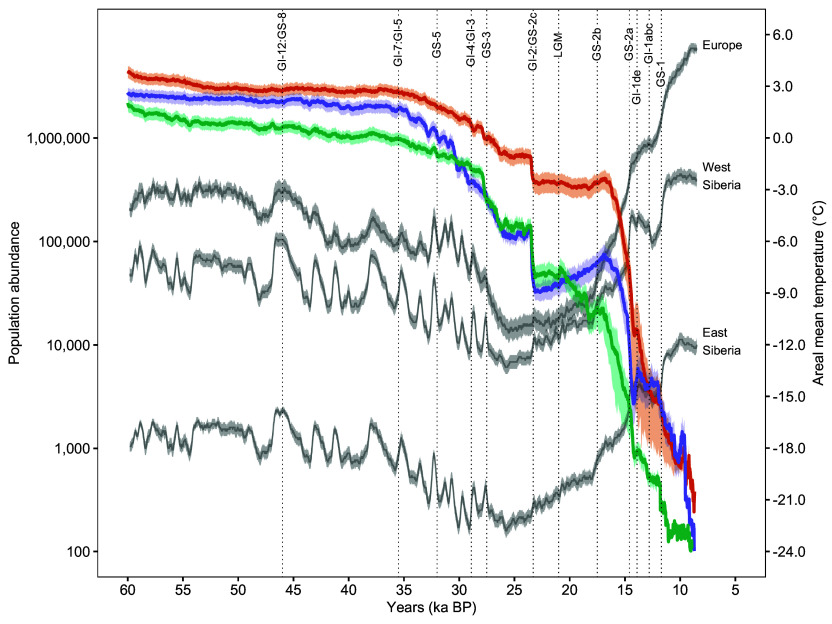
Fig. 2.
Abundance of woolly rhinoceroses across 52,000 y. Total population abundances (on a log-scale) for Europe (green), west Siberia (orange), and east Siberia (purple). Gray lines show the areal annual mean temperature for each region. Shaded areas show the 95% CI. Dotted lines indicate the boundaries of major stadial/interstadials (24). Regional boundaries are shown in Fig. 1.

