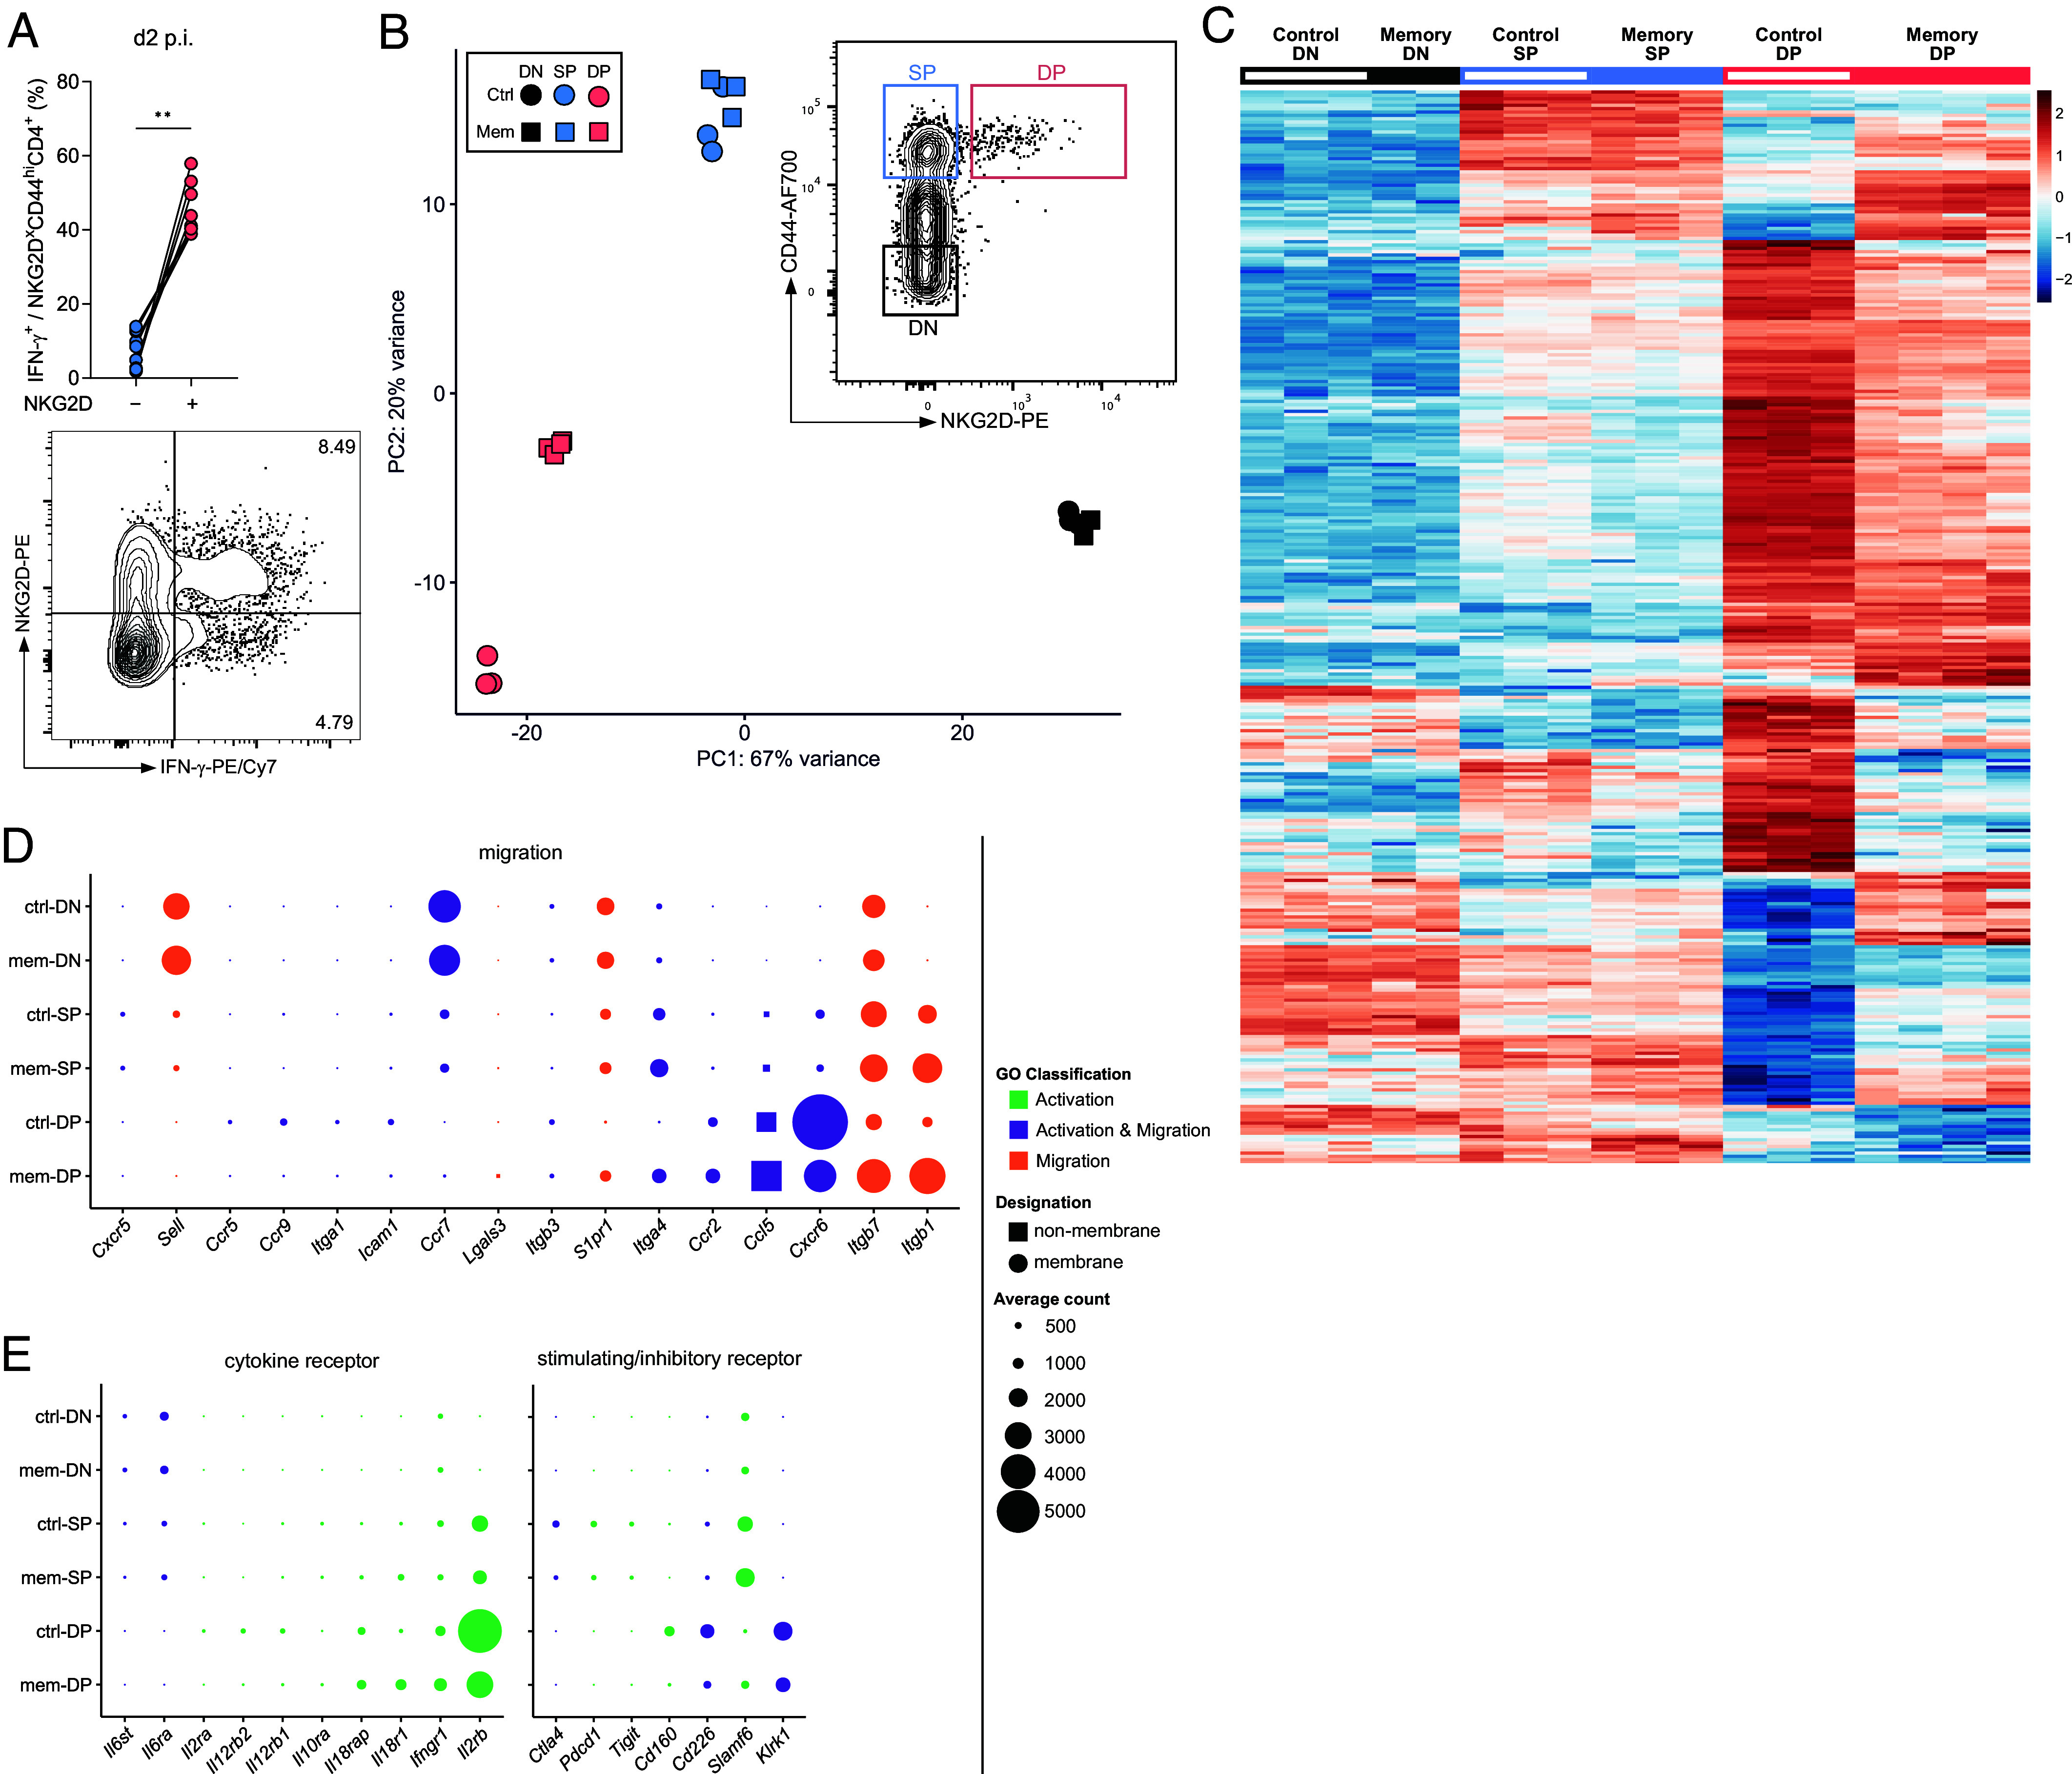
Fig. 2.

CD4+ TIA cells have a distinct transcriptional profile. (A) IFN-g response in NKG2D+ and NKG2D+ CD44+CD4+ T cells (Top) and representative FACS plot gated on CD44+CD4+ T cells (Bottom) obtained from lungs of LCMV memory mice challenged with Lpn (2 dpi; n = 9, Wilcoxon matched-pairs signed-rank test). (B–E) RNA-seq analysis of CD4+ T cells isolated from spleens of control (Ctrl) and LCMV memory (Mem) mice. (B) Sorting strategy and principal component analysis (PCA) of the resulting populations. (C) Heatmap of genes in CD44−NKG2D− (DN), CD44hiNKG2D− (SP), and CD44hiNKG2D+ (DP) CD4+ T cells from LCMV memory and control mice (averaged normalized count from any population ≥10). (D and E) Differentially expressed genes (DEGs) relating to T cell migration (D) or activation (E) are highlighted. Balloon plots depicting average counts of the indicated genes for each cell population. DEGs are color-coded according to their GO classification. A curated list of migration- or cytokine receptor- and stimulatory/inhibitory receptor-related genes is shown.
