Figure 2.
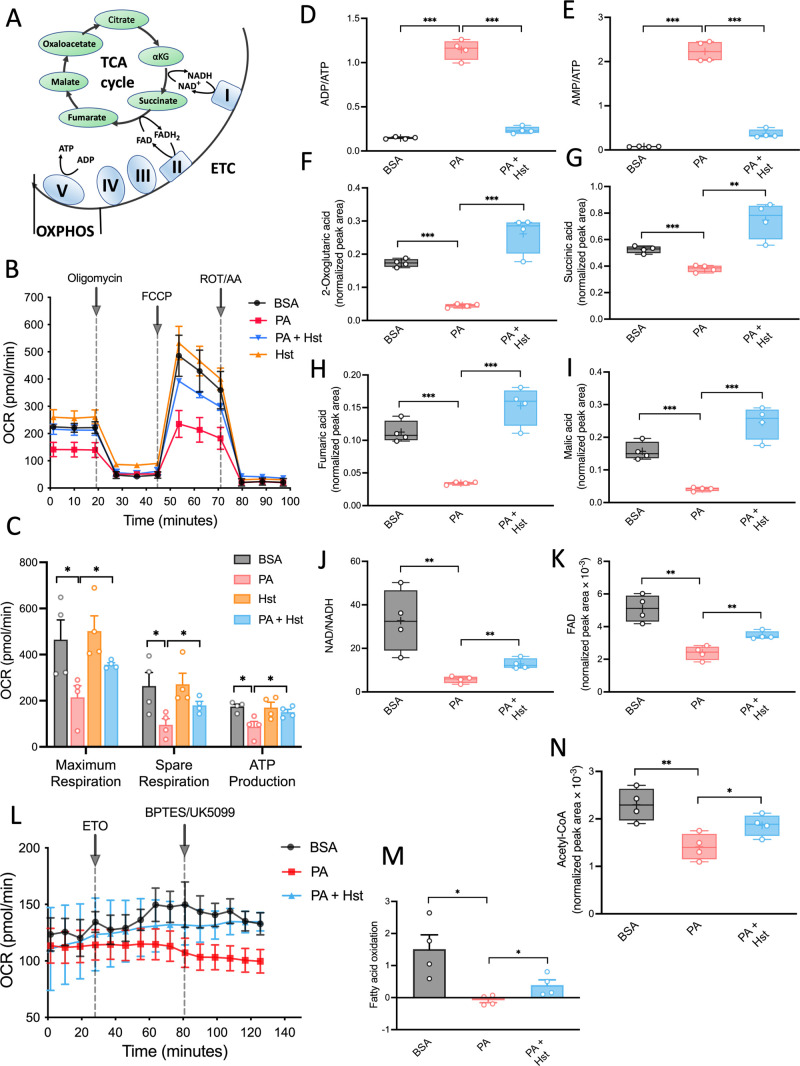
Hesperetin (Hst) elevated palmitic acid (PA)-induced abnormal mitochondrial metabolism in HepG2 cells. Cells were preincubated with Hst (40 μM) for 4 h and then exposed to PA (400 μM) for 24 h. (A) Schematics of the TCA cycle and OXPHOS. (B) Oxygen consumption (OCR) and (C) individual parameters for maximum respiration, spare respiration, and ATP production. (D,E) Ratio of ADP/ATP and AMP/ATP. (F–K) Intercellular levels of metabolites from the TCA cycle. MS peak areas were normalized to internal standards and corresponding pellet protein concentration. (L,M) Fatty acid dependency of OXPHOS was measured by a Seahorse Excellular Flux Analyzer. (N) Intercellular levels of acetyl-CoA. MS peak areas were normalized to internal standards and corresponding pellet protein concentration. Data are presented as mean ± SEM of n = 4 independent experiments. *p < 0.05, **p < 0.01, ***p < 0.001 (unpaired two-tailed student’s t test).

