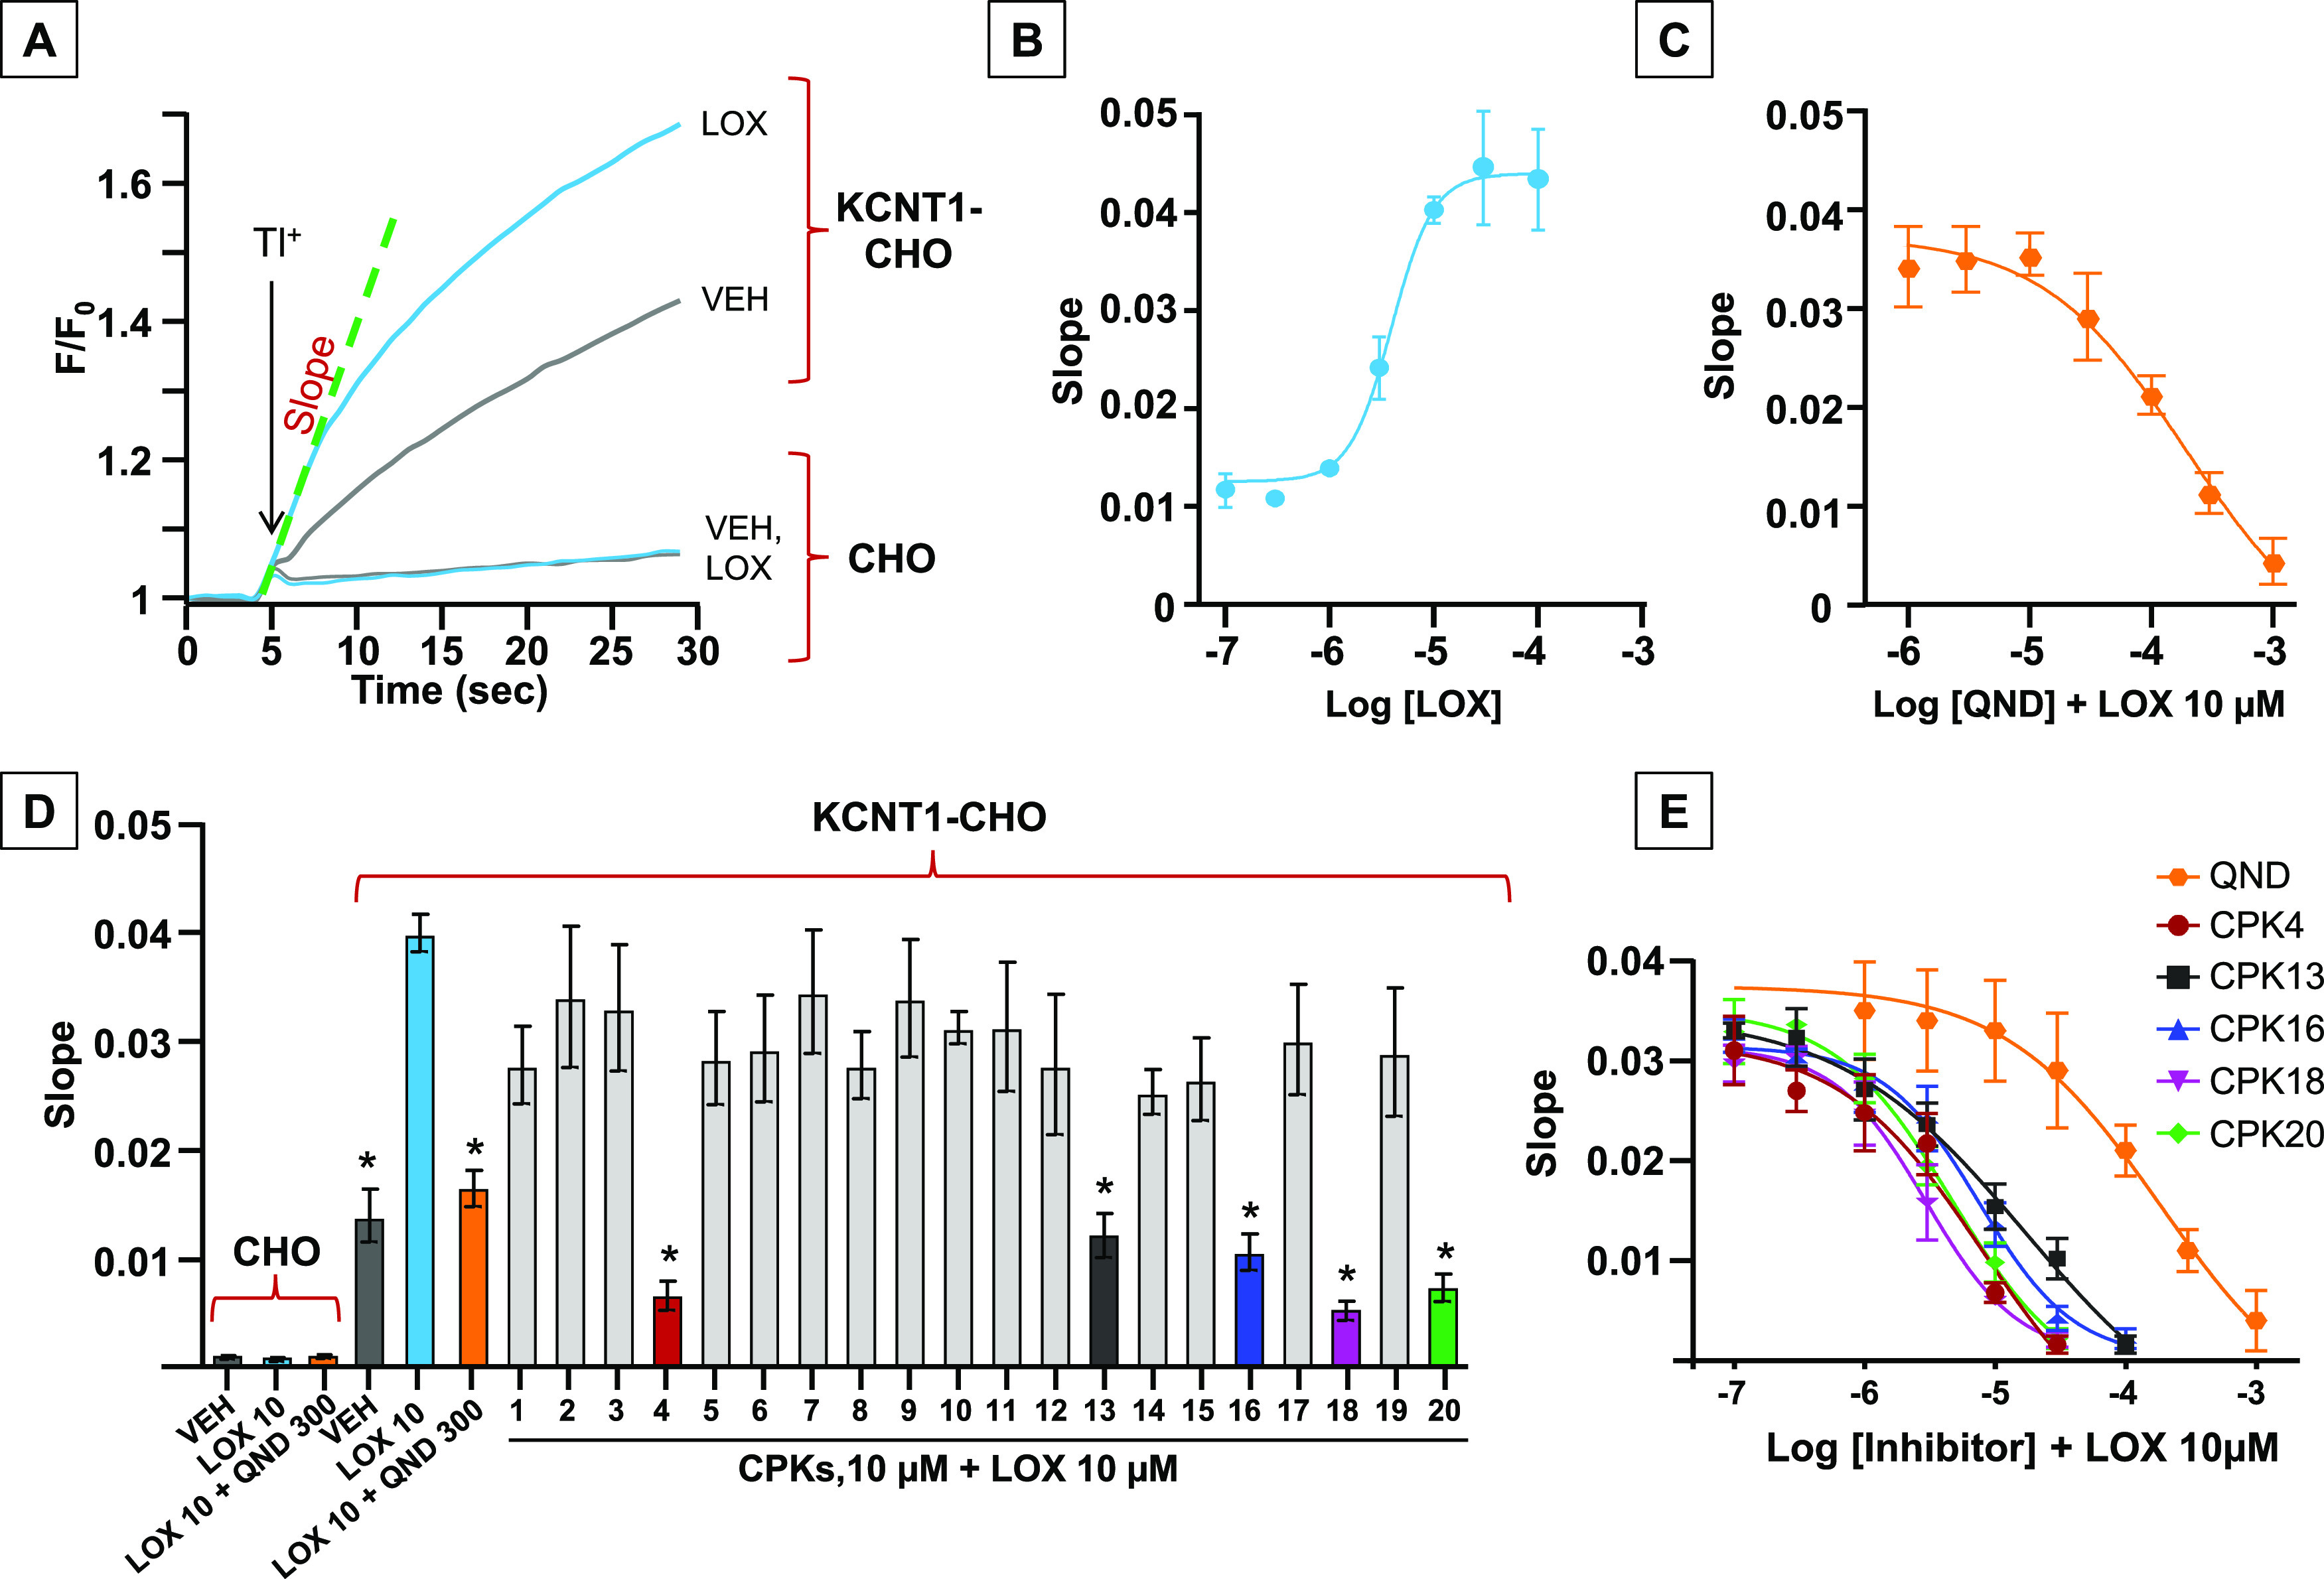
Figure 2.

In vitro screening of the CPK library using the fluorescence-based assay FluxOR. (A) Representative curves describing the FluxOR fluorescent signals generated in stably KCNT1-transfected CHO cells and in untransfected CHO cells after incubation with vehicle (VEH) (gray curve) or LOX 10 μM (light blue curve). (B, C) Concentration–response curves of LOX (B) and QND (C) in stably KCNT1-transfected CHO cells. Solid lines represent fits of the experimental data to the four-parameter logistic equation used to estimate EC50/IC50 values. (D) Average FluxOR fluorescence signals obtained in stably KCNT1-transfected CHO cells and in untransfected CHO cells upon incubation with vehicle (VEH) (gray), LOX 10 μM (LOX, light blue), QND at 300 μM (orange), or with CPKs compounds, each at a concentration of 10 μM. QND and CPKs incubation was followed by incubation with LOX 10 μM. * indicates values significantly different (p < 0.05) from LOX (n = 5–13). (E) Concentration–response curves of QND (orange), CPK4 (red), CPK13 (black), CPK16 (blue), CPK18 (magenta), and CPK20 (green) in stably KCNT1-transfected CHO cells. Solid lines represent fits of the experimental data to the four-parameter logistic equation used to estimate IC50 values (n = 5).
