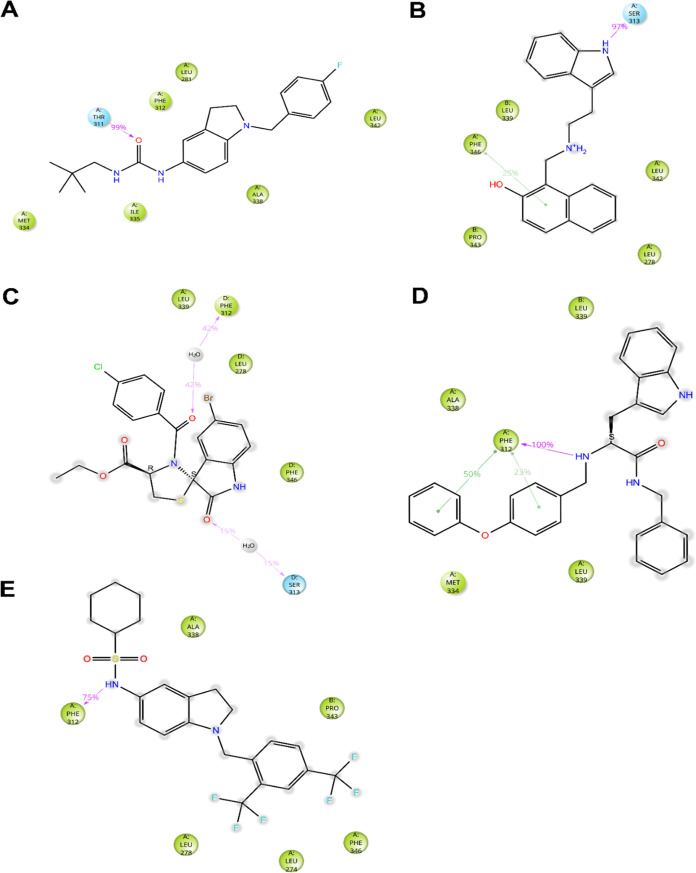
Figure 5.
Ligand interaction diagrams of CPK4 (A), CPK13 (B), CPK16 (C), CPK18 (D), and CPK20 (E) in complex with EMhKCNT1110–354. Only residues interacting with the ligand for at least 72 out of 480 ns of MD simulation are shown. Residues are colored according to the following scheme: Cyan, polar; green, hydrophobic; gray, water molecule. Gray halos highlight solvent exposure. H-bonds are represented by magenta arrows (dashed when side-chain atoms are involved, solid in the case of backbone atoms involvement); green solid lines represent π–π stacking interactions.

