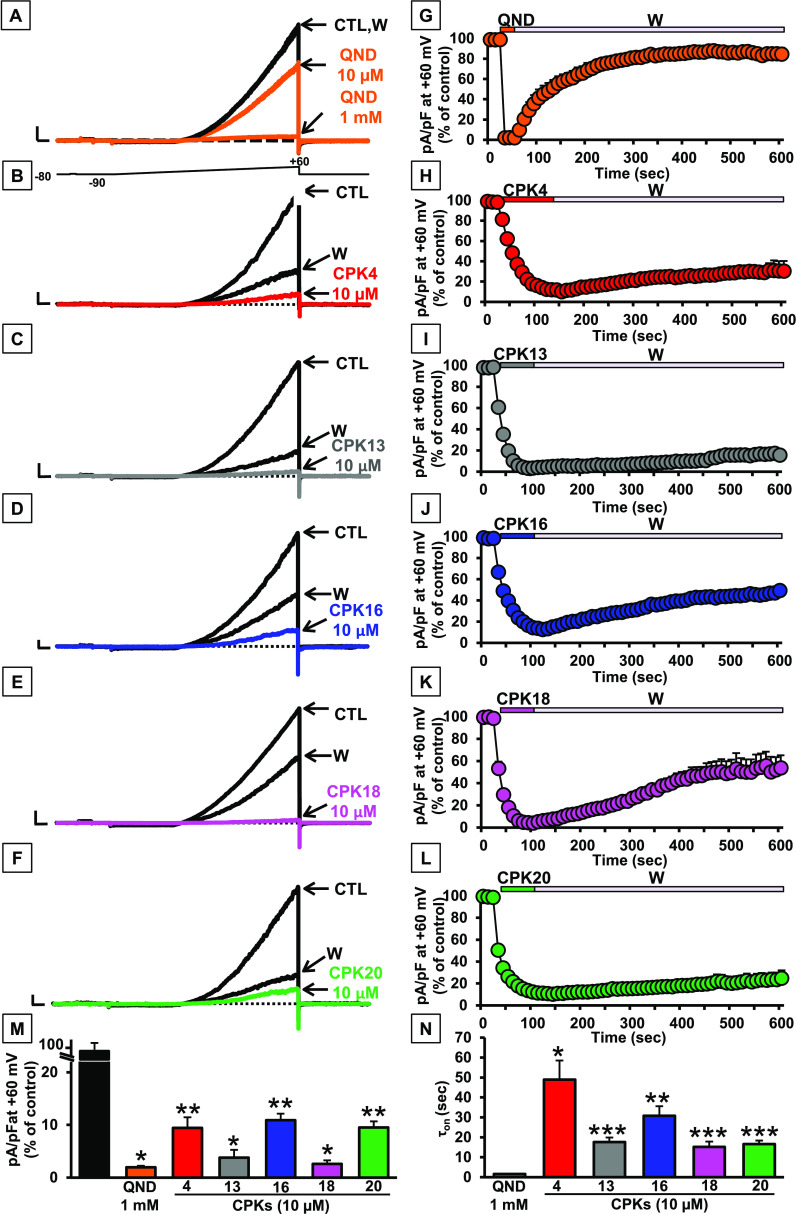
Figure 6.
Pharmacological characterization of QND and CPK compounds on KCNT1 channels. (A–F) Representative current traces recorded upon exposure to the voltage protocol shown in (A) in CHO cells expressing KCNT1 channels recorded in control solution (CTL), upon perfusion with 10 μM or 1 mM QND (QND; A), 10 μM of the indicated CPK compounds (B–F), or upon drug washout (W). Current scale: 1 nA; time scale: 100 ms. (G–L) Time course of current decrease and recovery in CHO cells expressing KCNT1 channels in the absence or presence of the indicated compounds. (M) Quantification of maximal currents measured in cells expressing KCNT1 channels at +60 mV in experiments like those shown in (A–F) in the presence of the indicated compounds (*=p < 0.05 vs CTL; **=p < 0.05 vs QND). (N) Time constants of the activation kinetics (τon) in seconds for all tested compounds (*=p < 0.05 vs QND; **=p < 0.05 vs CPK4; ***=p < 0.05 vs CPK16).

