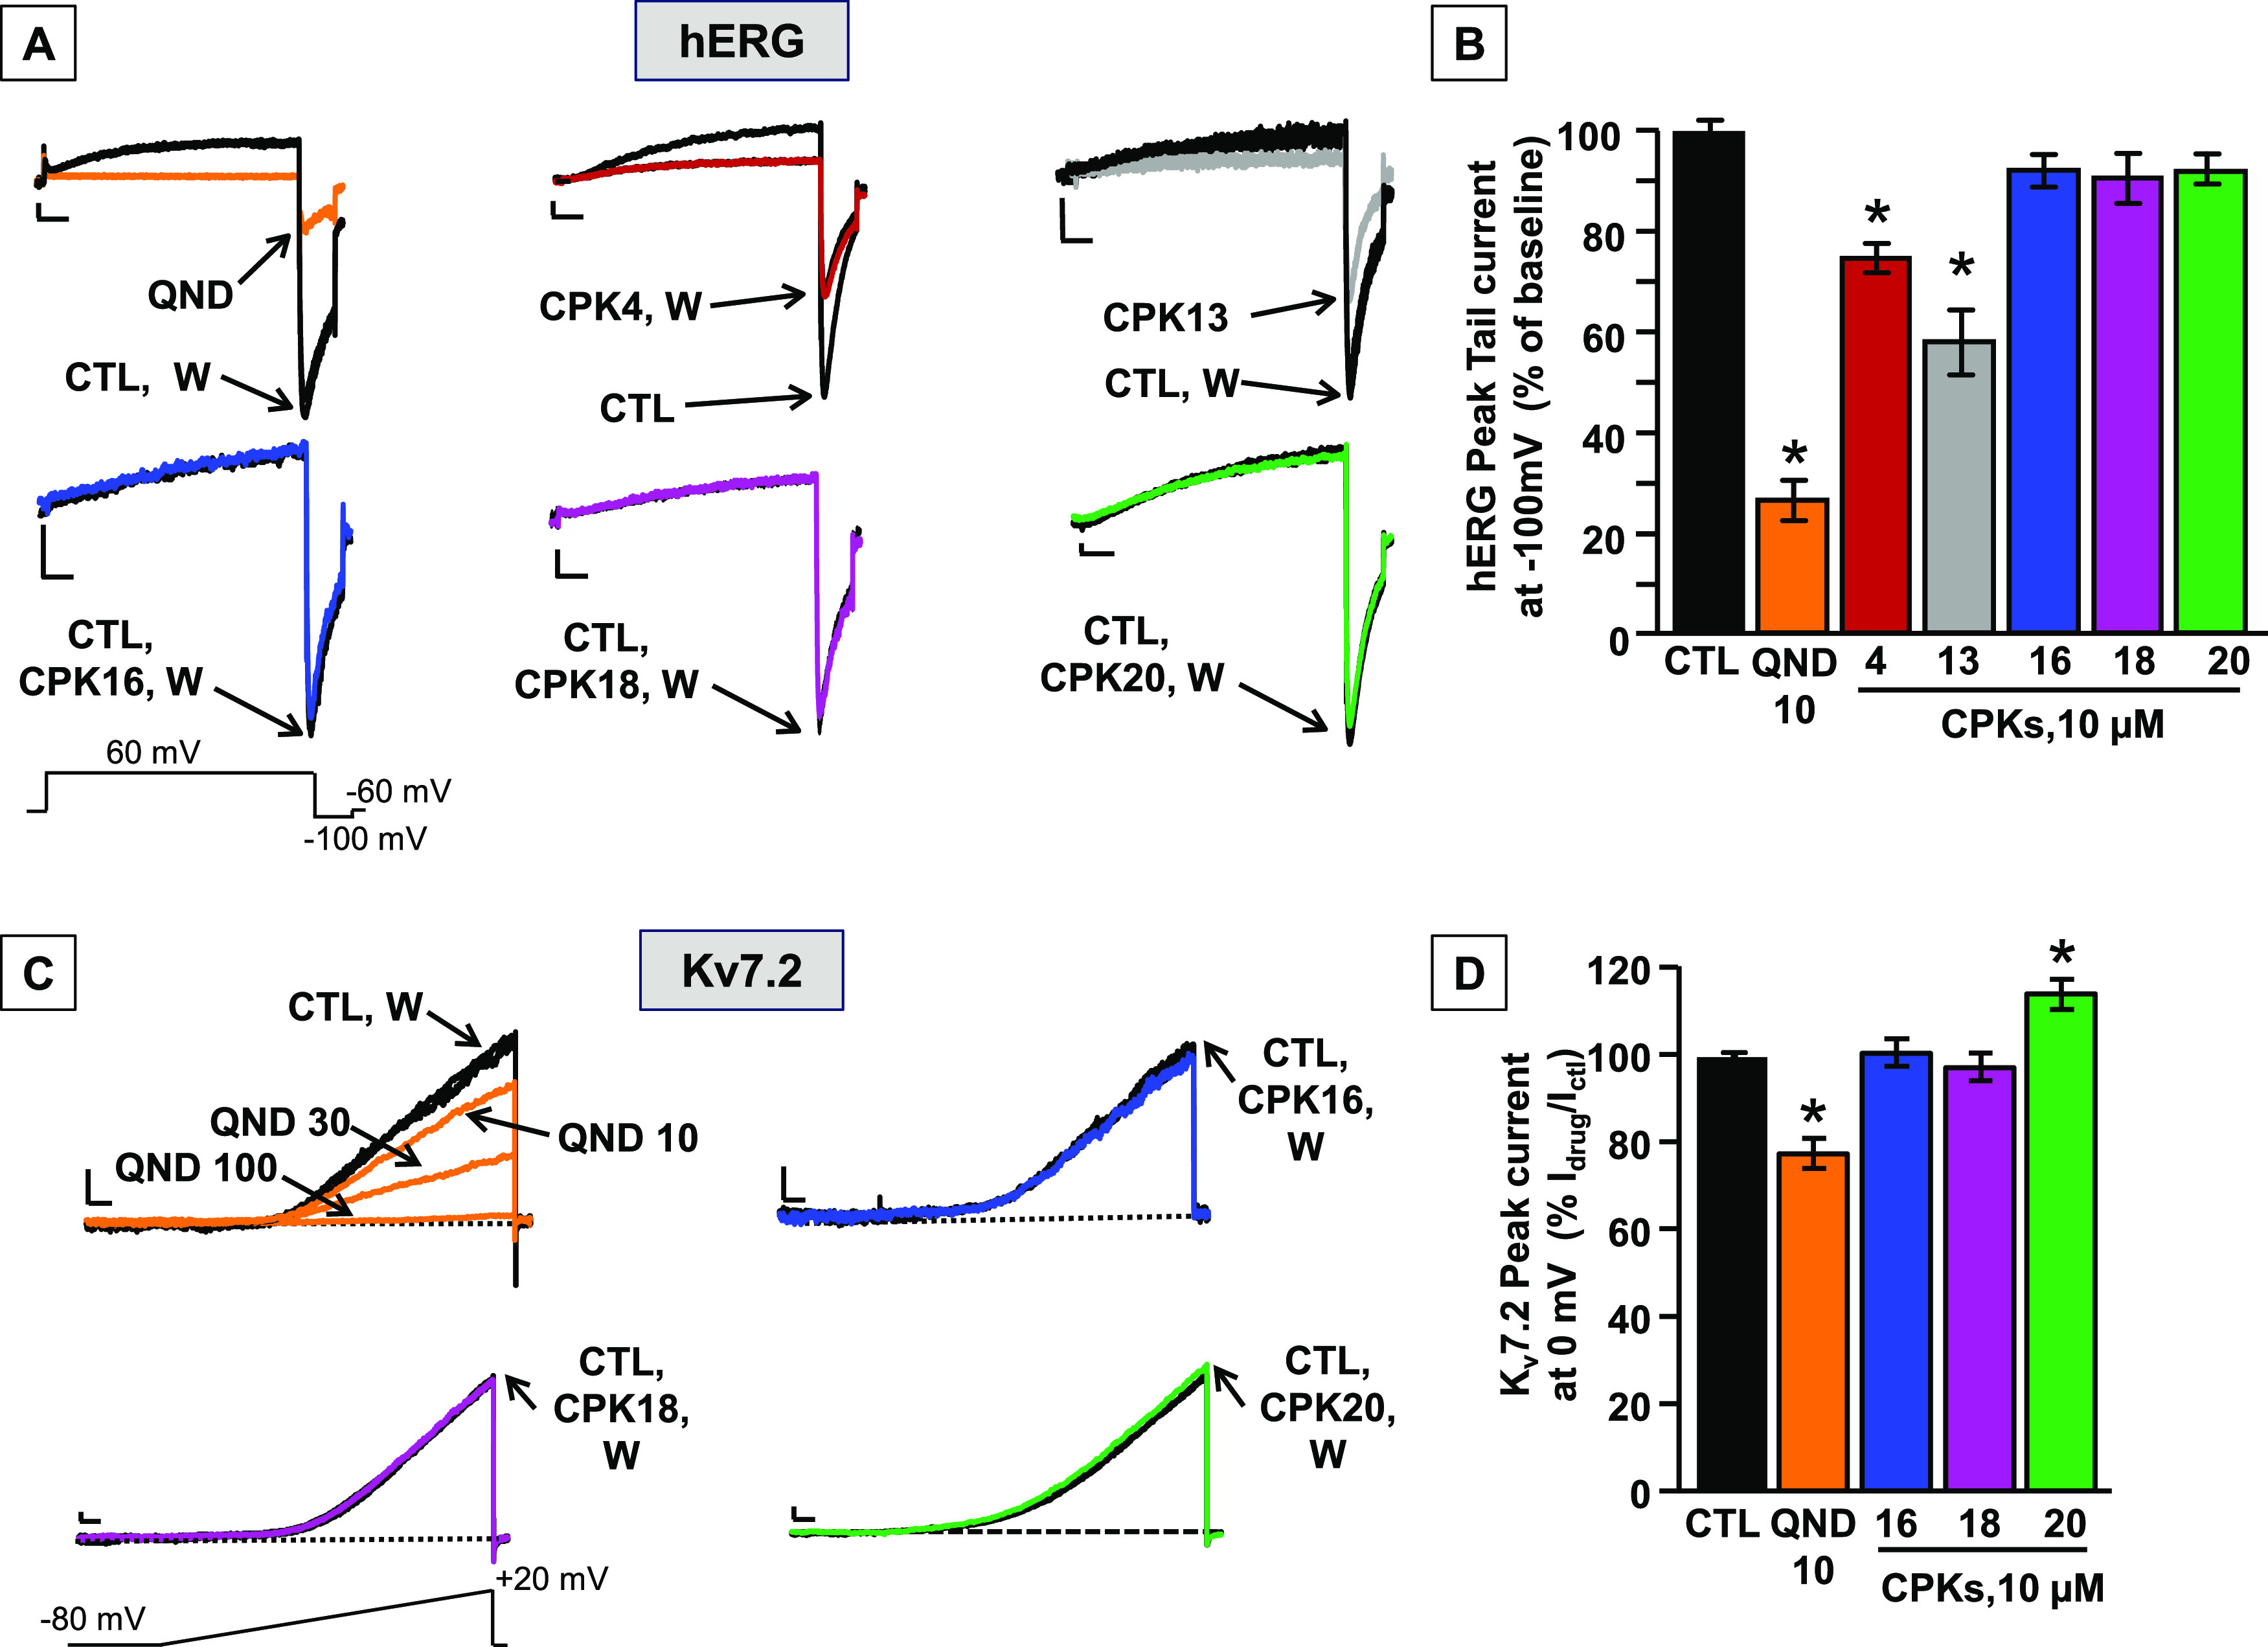
Figure 7.

Effects of QND and CPK compounds on hERG and Kv7.2 channels. (A) Representative whole-cell current traces from hERG channels activated by the indicated ramp protocol recorded in control conditions and upon exposure to 10 μM quinidine (QND), 10 μM of the indicated CPK compounds, or upon drug washout (W). Current scale: 100 pA; time scale: 500 ms. (B) Quantification of the effects of the indicated compounds on hERG currents; data are expressed as the ratio between current amplitude at −100 mV in the presence and absence of 10 μM drugs (Idrug/ICTL); control value was calculated as the ratio between current amplitude at −100 mV at the beginning and after 1 min of perfusion with extracellular solution. Each data point is expressed as the mean ± SEM of at least three cells recorded in at least two independent transfections. * indicates values significantly different (p < 0.05) from control. (C) Representative whole-cell current traces from Kv7.2 channels activated by the indicated ramp protocol recorded in control conditions and upon exposure to 10–30–100 μM QND, 10 μM of the indicated CPK compounds, or upon drug washout (W). Current scale: 200 pA; time scale: 200 ms. (D) Quantification of the effects of the indicated compounds on Kv7.2 currents; data are expressed as the ratio between current amplitude at 0 mV in the presence and absence of 10 μM drugs (Idrug/ICTL); control value was calculated as the ratio between current amplitude at 0 mV at the beginning and after 1 min of perfusion with extracellular solution. Each data point is expressed as the mean ± EM of at least three cells recorded in at least two independent transfections. * indicates values significantly different (p < 0.05) from control.
