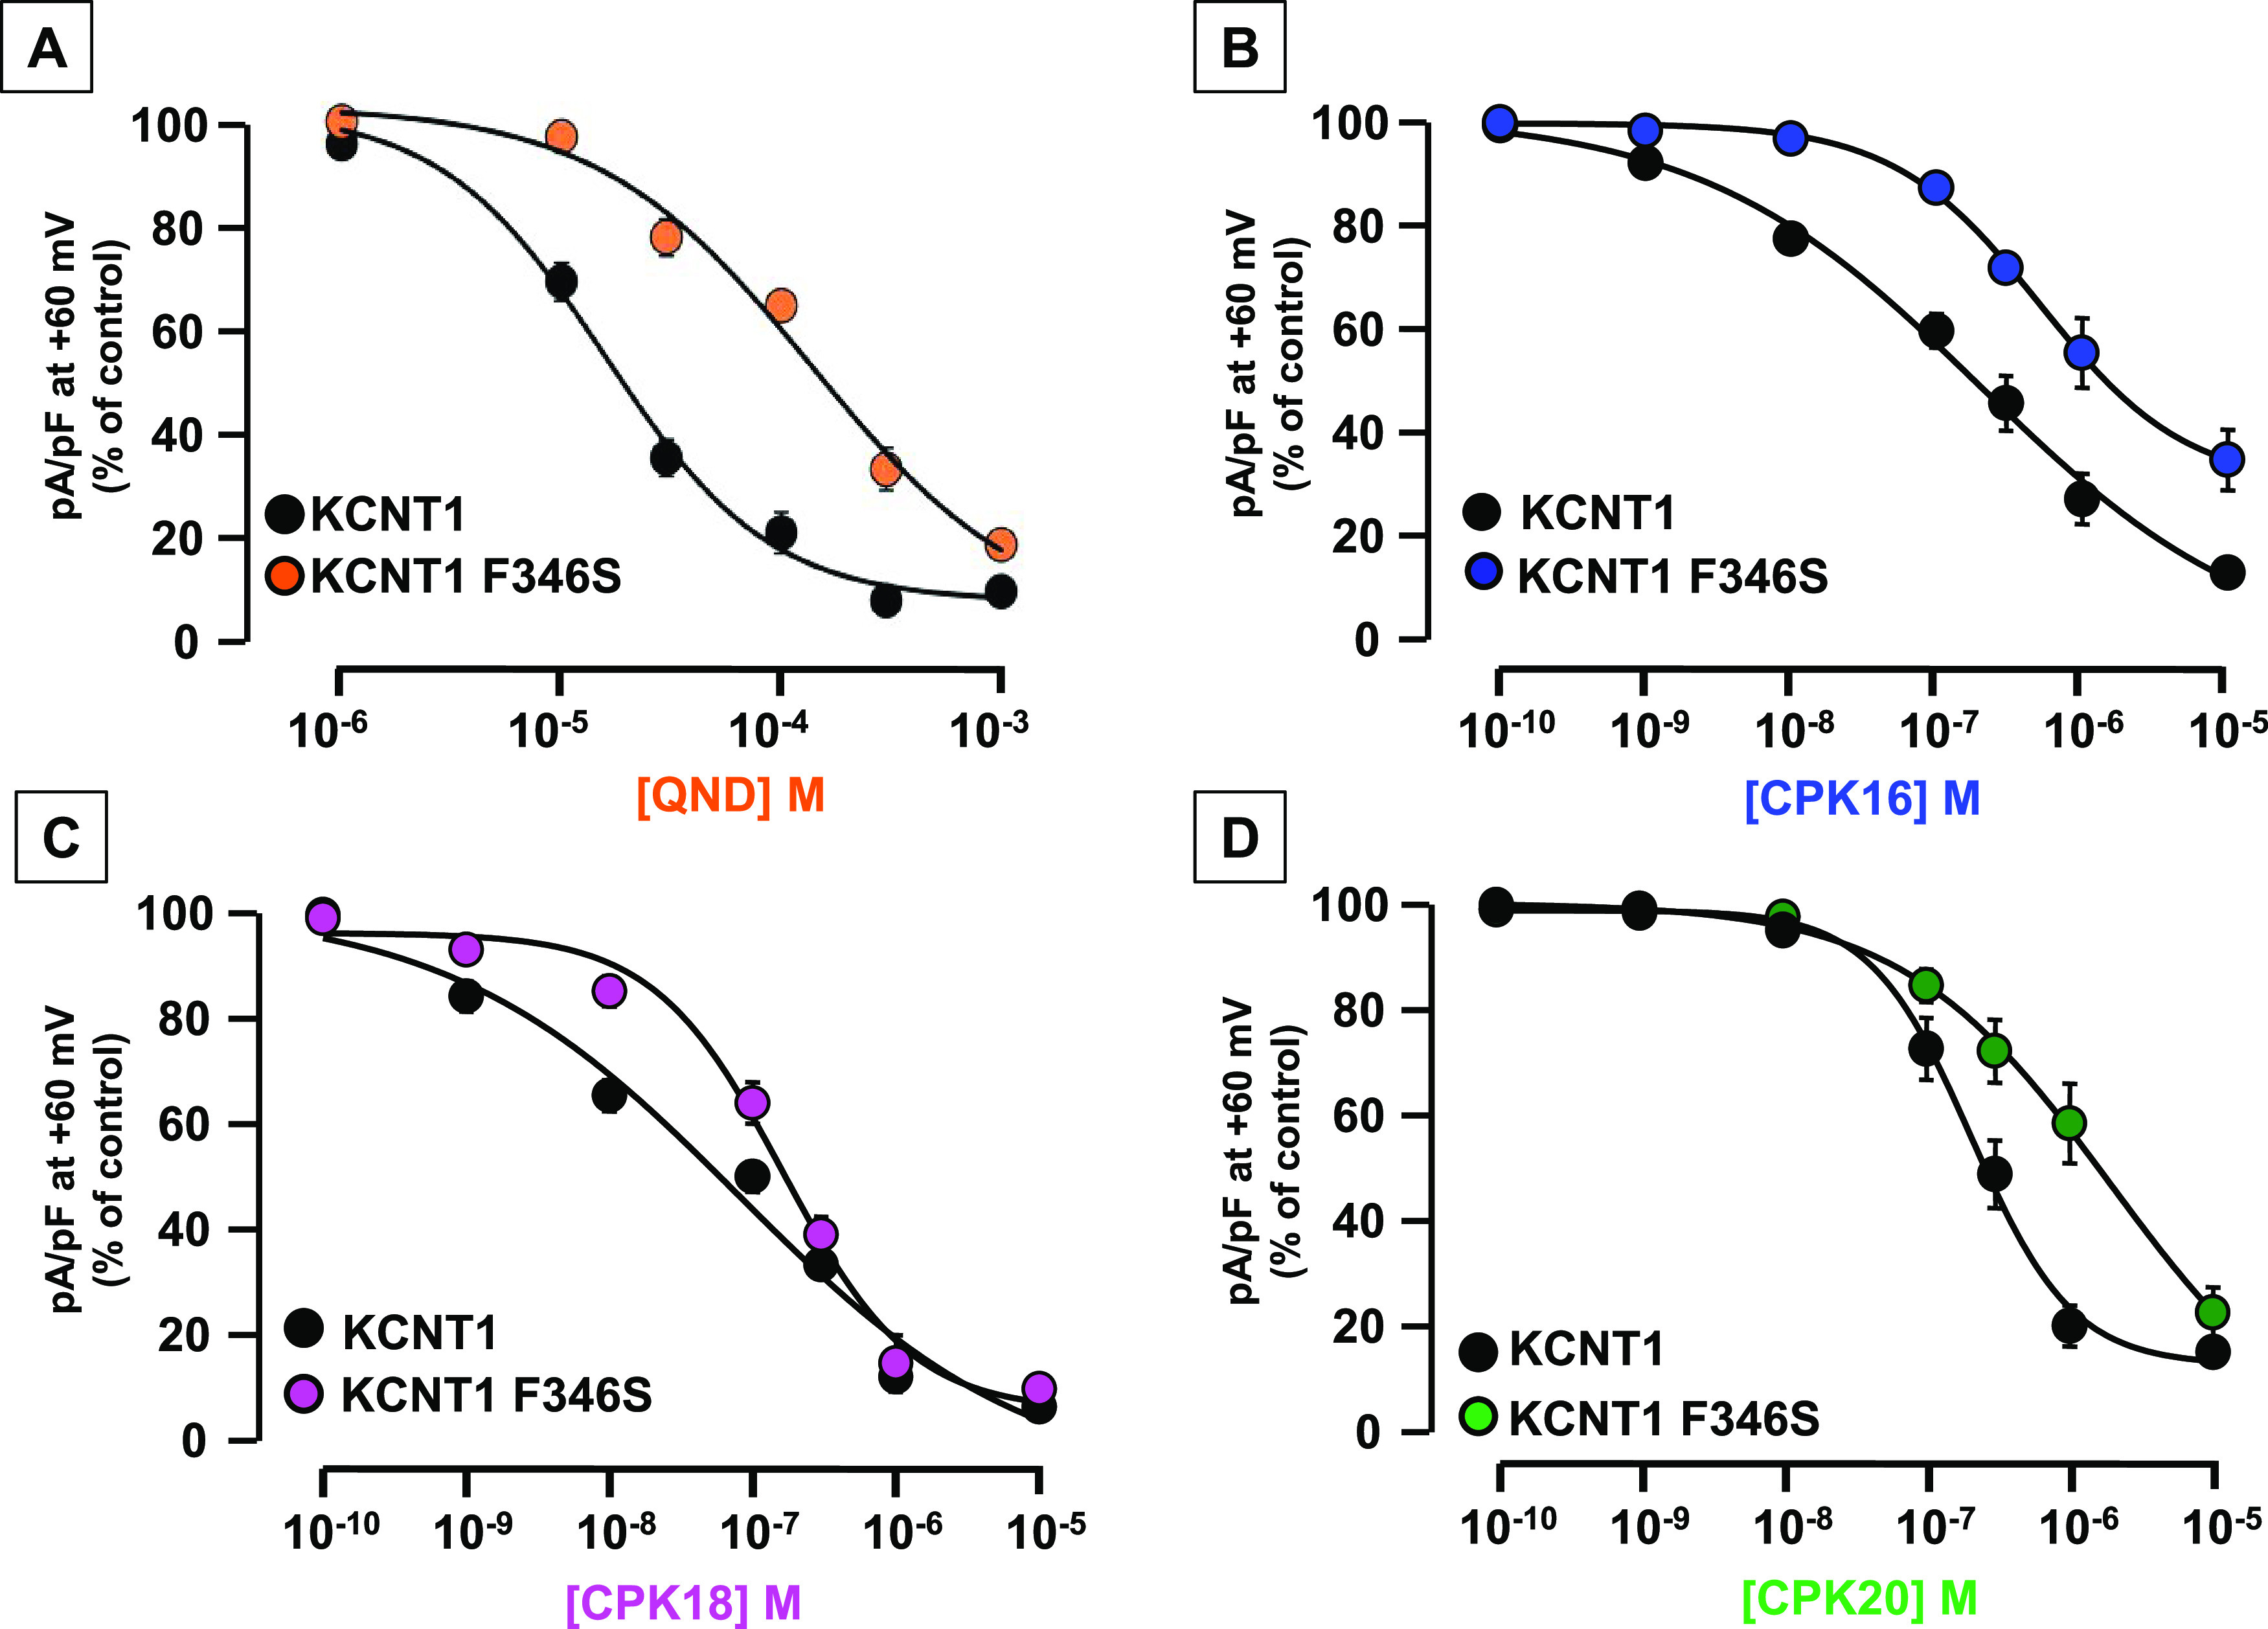
Figure 8.

Concentration–response curves for KCNT1 and KCNT1 F346S inhibition current by (A) QND, (B) CPK16, (C) CPK18, and (D) CPK20. Current density after exposure to each drug concentration was expressed as % of the control current; normalized data were fitted to the following binding isotherm: y = max/(1 + x/EC50)n, where x is the drug concentration and n is the Hill coefficient. Each data point is the mean ± SEM of 3–26 (for QND), 5–45 (for CPK16), 5–81 (for CPK18), or 4–35 (for CPK20) determinations.
