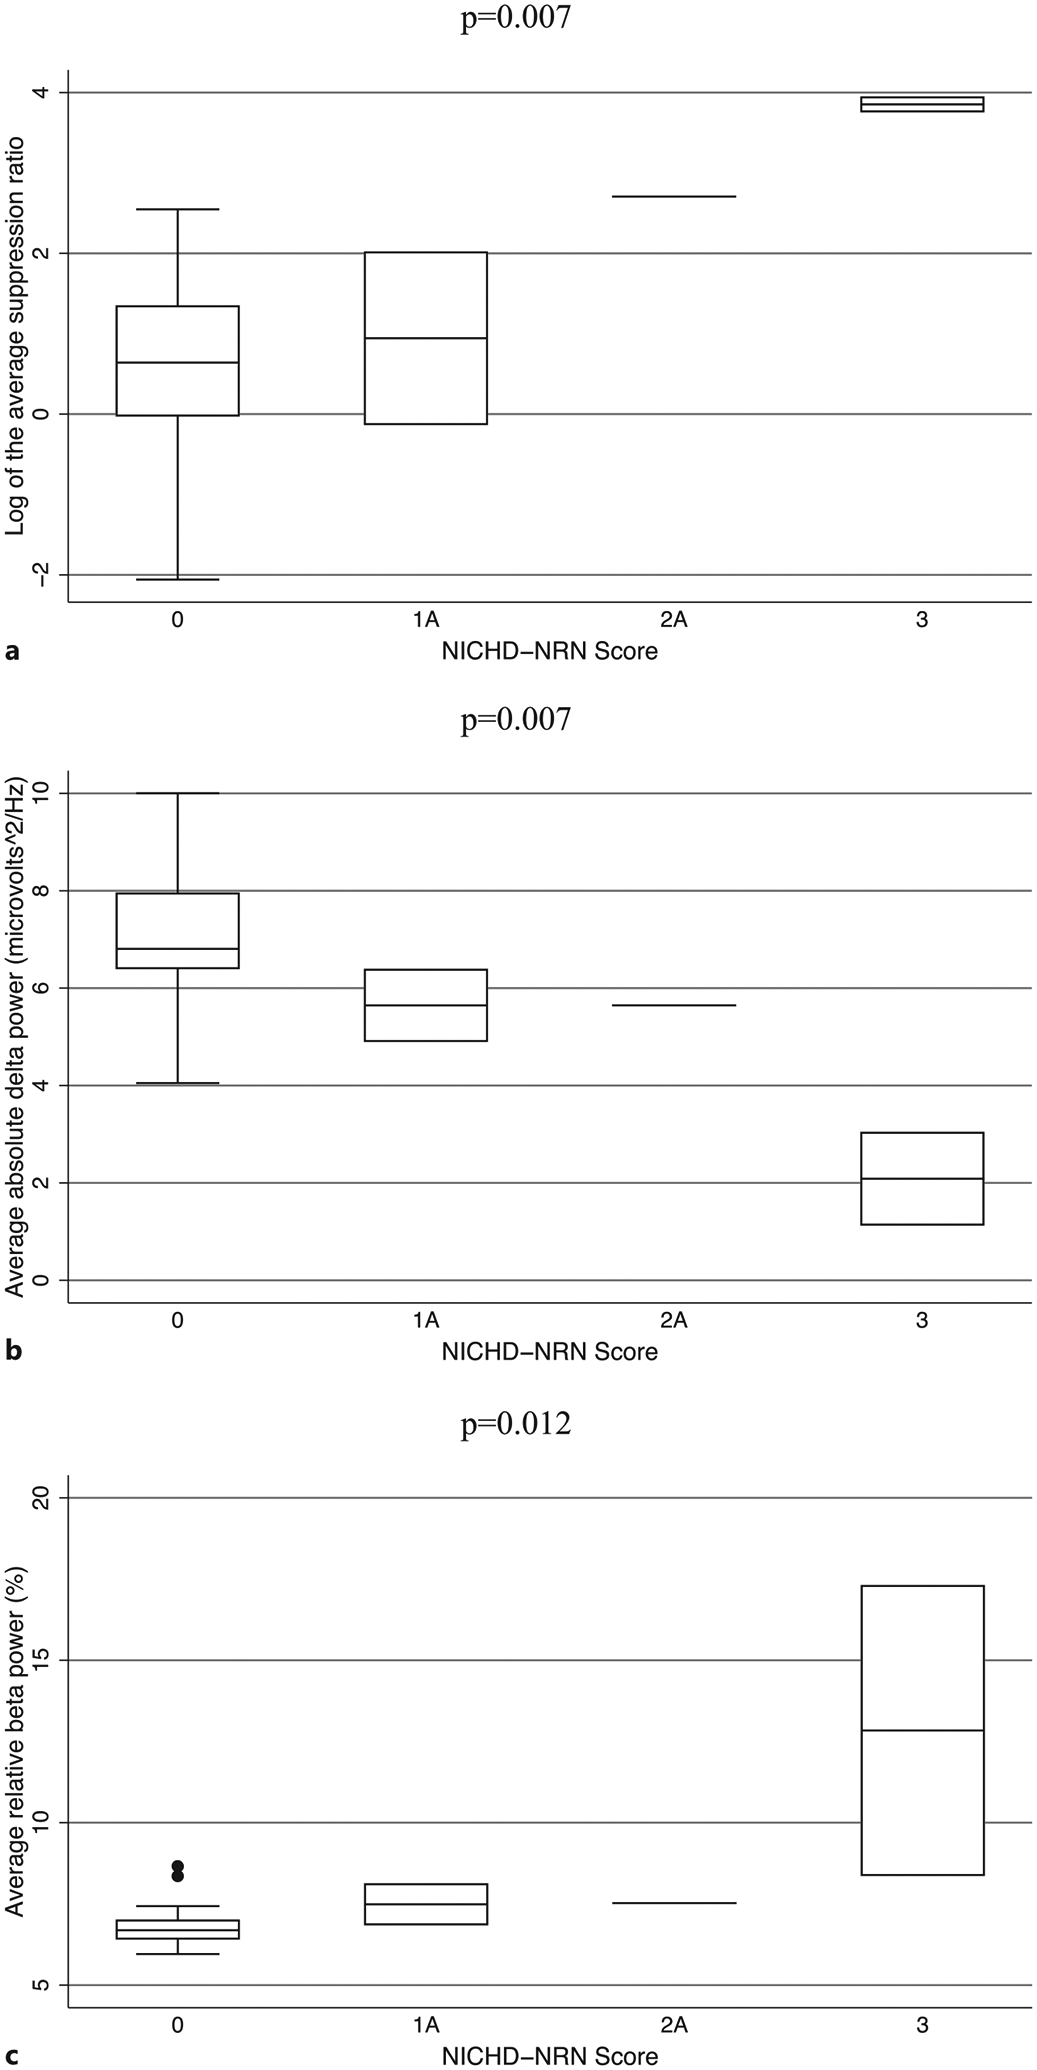
Fig. 3.

Boxplots showing the median and interquartile range of the SR (a), absolute delta power (b), and relative beta power (c) by NICHD-NRN imaging score in the post-rewarming phase of TH in 21 neonates with NE. All results shown remained significant after correction for multiple comparisons.
