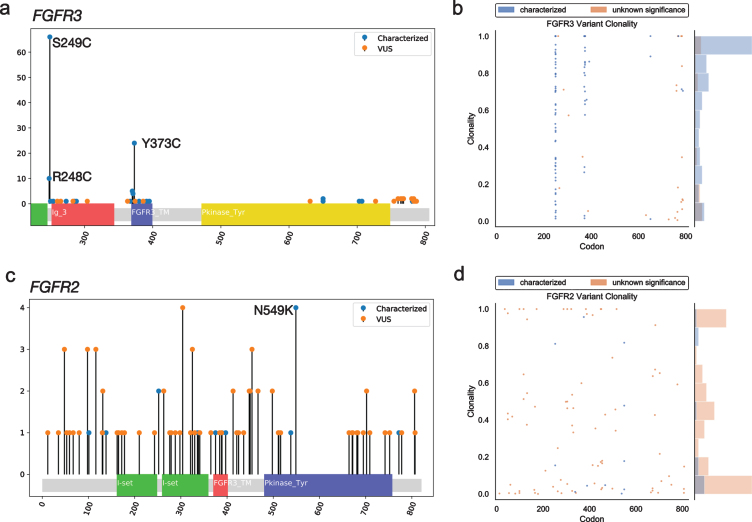
Fig. 2.
Mutational spectrum and clonality assessment of nonsynonymous FGFR2/3 SNVs. Lollipop plots show the location and number of observed GAs in FGFR3 (a) and FGFR2 (c), by characterized vs. VUS status. Clonality plots (right) show the copy number-adjusted clonality and relative frequency of the spectrum of clonality of both characterized and VUS GAs observed in FGFR3 (b) and FGFR2 (d). VUS, variant of uncertain significance.

