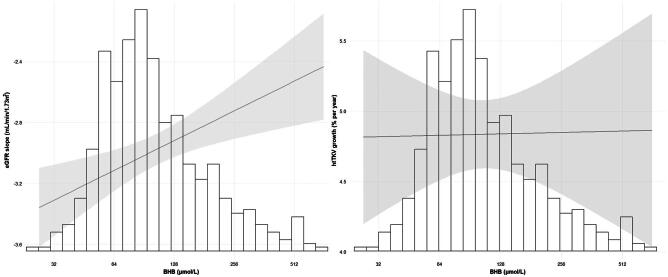
Figure 1:
The distribution of BHB (µmol/L) and the association of BHB with the eGFR slope (left panel) and htTKV growth (right panel). The line estimates the influence of BHB on the eGFR slope and htTKV growth adjusted for sex, age, copeptin, SBP and PKD mutations. The shaded area is the 95% CI of the estimate. The x-axes represent the back-log transformed BHB values and its corresponding histogram. The y-axis on the left panel represents the eGFR slope (mL/min/1.73 m2) and on the right panel the htTKV growth (% per year).

