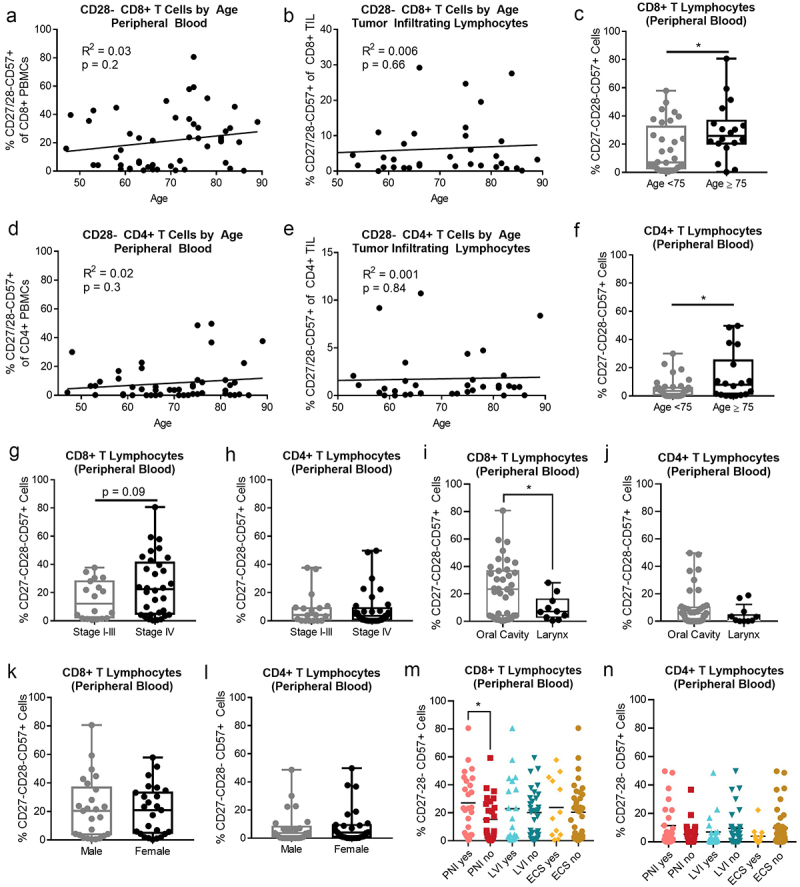
Figure 2.

CD27/28-CD57+ T cells are more abundant in the peripheral blood of HNSCC patients over age 75. (a) Correlation between percent of CD27/28-CD57+ CD8+ T cells in the peripheral blood versus age. (b) Correlation between percent of CD27/28-CD57+ CD8+ T cells in the tumor versus age. (c) Percent of CD27/28-CD57+ CD8+ T cells in the peripheral blood of patients <age 75 versus ≥age 75. (d) Correlation between percent of CD27/28-CD57+ CD4+ T cells in the peripheral blood versus age. (e) Correlation between percent of CD27/28-CD57+ CD4+ T cells in the tumor versus age. (f) Percent of CD27/28-CD57+ CD4+ T cells in the peripheral blood of patients <age 75 versus ≥age 75. (g, h) Percent of CD27/28-CD57+ CD8+ T cells (G) and CD4+ T cells (h) in the peripheral blood of patients according to disease stage. (i, j) Percent of CD27/28-CD57+ CD8+ T cells (i) and CD4+ T cells (j) in the peripheral blood of patients according to anatomic site. (k, l) Percent of CD27/28-CD57+ CD8+ T cells (k) and CD4+ T cells (l) in the peripheral blood of patients according to sex. (m, n) Percent of CD27/28-CD57+ CD8+ T cells (m) and CD4+ T cells (n) in the peripheral blood of patients according to histopathologic features including perineural invasion (PNI), lymphovascular invasion (LVI) and extracapsular spread (ECS). Box plot whiskers depict min and max. *p < .05 by student’s t test.
