Figure 3.
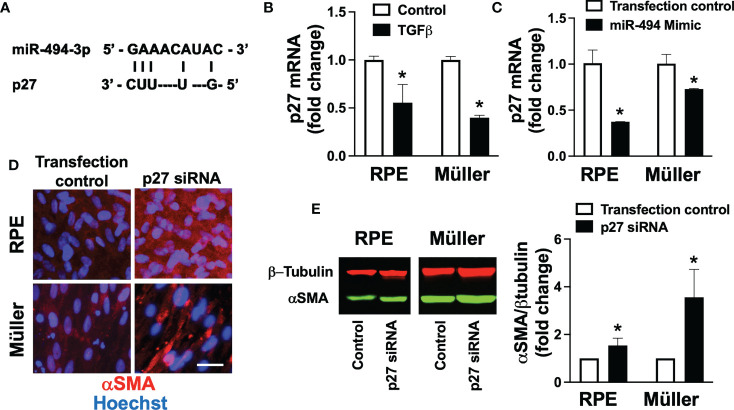
p27 in TGFβ-induced fibrotic transformation. (A) Diagram of reverse complementary miR-494 and p27 binding sites. (B) Quantification of p27 mRNA in human RPE and Müller cell lines with and without TGFβ treatment. (C) Quantification of p27 mRNA in human RPE and Müller cell lines with and without miR-494 mimic treatment. (D) Representative immunofluorescent images of αSMA (red) in human RPE and Müller cell lines with DAPI (blue) after 72h TGFβ treatment with and without pre-treatment and co-incubation with p27 small interfering RNA (siRNA). (E) Quantification of αSMA in human RPE and Müller cell lines by immunoblot (representative blots left) after 72h TGFβ treatment with and without pre-treatment and co-incubation with p27 siRNA. Mean ± SEM, * p<0.05 versus control condition.

