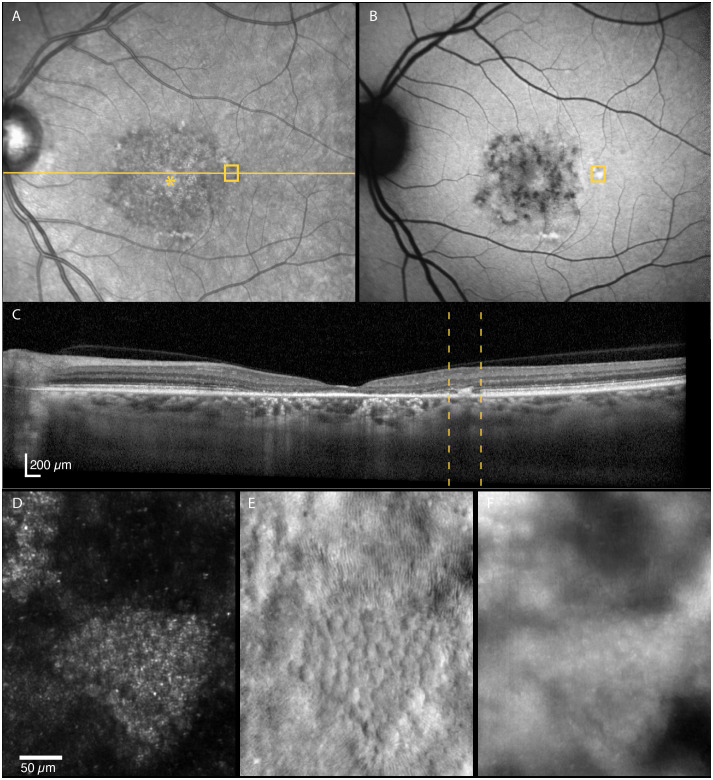
Figure 6.
Multimodal imaging of an area near the transition zone between the atrophic and non-atrophic retina region (≈5 degrees temporal of the foveal center, (A–E)]. A small mosaic of polygonal structures, hypothesized to be RPE cells, is seen on the non-confocal split-detection image (E). The corresponding location on the autofluorescence image shows a hyperreflective area (B), whereas hyperreflectivity/thickening at the level of RPE-photoreceptor complex can be seen on OCT (C). The RPE-like structures appear hyperreflective with darker edges on confocal reflectance (D) and dark field (F) images. The location imaged in (D–F) is indicated by yellow boxes in (A) and (B) and by yellow dotted lines in (C).

