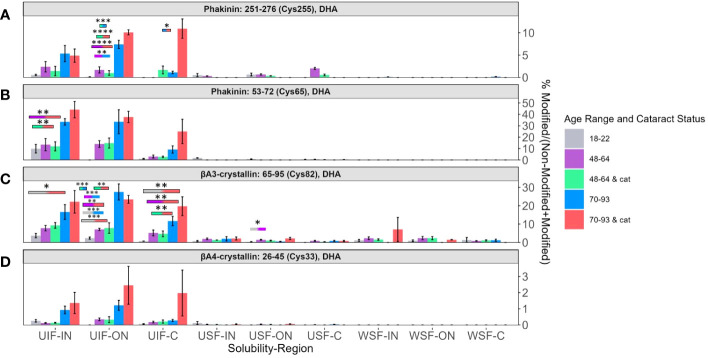
Figure 5.
Relative abundance of DHA containing peptides associated with aging. Relative levels of DHA are shown for (A) BFSP2 (Phakinin) Cys255, (B) BFSP2 Cys65, (C) βA3-crystallin Cys82, and (D) βA4-crystallin Cys33. Boxes above each result are colored to show which groups are statistically significantly (p<0.05) different. Boxes outlined in black represent comparisons where at least one lens group has cataracts; boxes without outlines represent comparisons where neither lens groups have cataracts. An asterisk (*) represents a p-value less than 0.05; ** represents a p-value less than 0.01; *** represents a p-value less than 0.001; and **** represents a p-value less than 0.0001.

