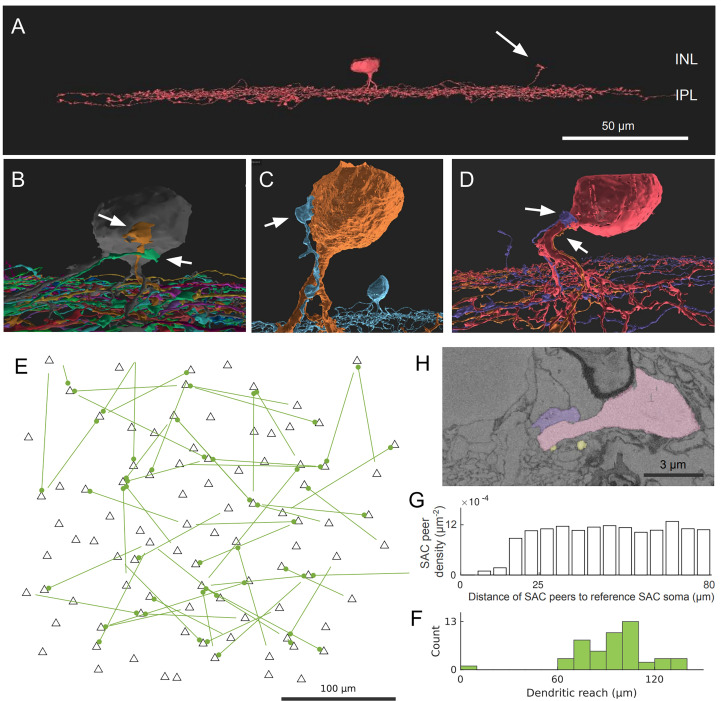
Figure 1.
Off SAC contact pattern. (A) Tangential view of a 3D-reconstructed Off SAC. An ascending dendrite (arrow) veers off from the dendritic stratification and into the inner nuclear layer (INL). (B–D) In each of these 3D perspective views, attached to the soma or basal dendrite of an Off SAC, we see ascending dendrites (arrows) from other Off SACs like in (A), usually climbing along the perisomatic dendrite. (E) Spatial distribution of the somatic origin and attachment points of these ascending dendrites in the retinal patch (flat-mount view). Each line represents the dendritic branch starting from the originating cell’s soma (the bare end of the line) and grasping onto the targeted cell’s perisomatic membrane (the bulged end of the line as a dot); black triangles are soma locations of all reconstructed Off SACs with soma inside the retinal patch. (F) Histogram showing the distribution of these ascending dendrites’ dendritic reach, defined as the planar distance from the ascending dendrite’s originating soma to the soma where it terminates. Minimum, quartiles, and maximum: 9, 81, 97, 104, and 137 μm. (G) The density recovery profile, for all Off SAC somas, regardless of whether any ascending dendrite contact or not, is defined as the average density of somas at given distances from any given soma (20). (H) A mini region of the plasma-membrane-stained retina sample, shown as a sectional electron micrograph near the locations pointed to in (D), overlaid with the respective reconstructed cells’ colors matching panel (D). Scale bars: 50μm (A); 100μm (E); 3μm (H).

