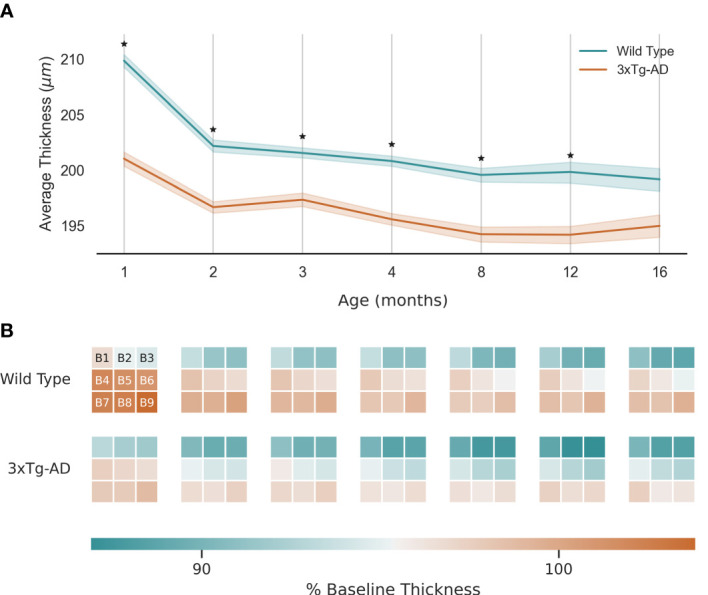
Figure 3.

Retinal thickness longitudinal variation: (A) - Average thickness and standard deviation (line and filled area, respectively) over 16 months for wild type and the triple transgenic (3xTg-AD) mice. (B) - Average thickness variation per region (B1-9, as shown). Thickness presented as % of baseline thickness, defined as the average retinal thickness of wild type mice aged 1 month. Color scale as indicated by the color bar. ★ p<0.001.
