Figure 5.
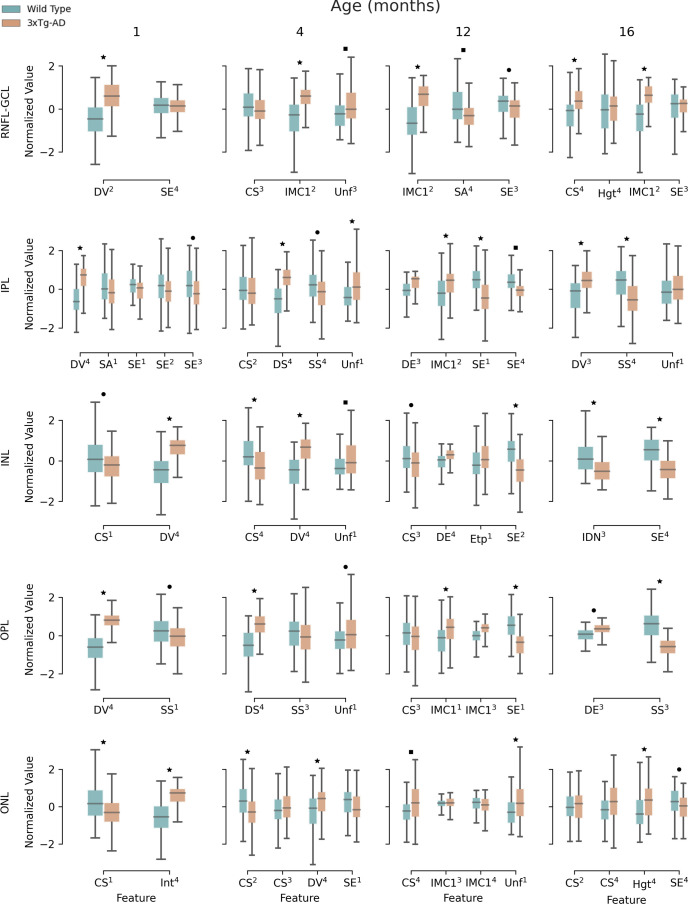
Retina texture. Boxplots for extracted textural features for 1-, 4-, 12-, and 16-month-old mice, for wild type and the triple transgenic (3xTg-AD) mice discriminated per retinal layer (RNFL-GCL complex and IPL, INL, OPL, ONL, IS, OS, and RPE layers). Median, first, and third quartiles are represented. Whiskers at each quartile plus 1.5 times the interquartile range. All features were normalized to have zero mean and unit standard deviation. Feature name and quadrant (superscript) as indicated. Correlated features (p<0.05) per layer and time point were excluded. CS – Cluster Shade; DE – Difference of Entropy; DS – Dissimilarity; DV – Difference of Variance; Etp – Entropy; Hgt – Homogeneity; IDN – Inverse Difference Moment Normalized; IMC1 – Information Measure of Correlation 1; SA – Sum Average; SE – Sum of Entropy; SS – Sum of Squares; Unf – Uniformity; RNFL-GCL – retinal nerve fiber layer and ganglion cell layer complex; IPL – inner plexiform layer; INL – inner nuclear layer; OPL – outer plexiform layer; ONL – outer nuclear layer. ▪ p<0.05; ● p<0.01; ★ p<0.001. These limits were corrected for multiple comparisons using the Bonferroni method.

