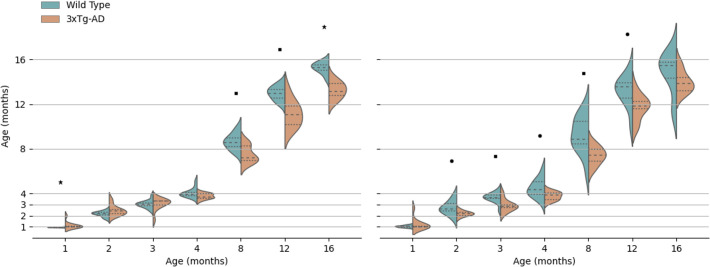
Figure 6.
Kernel density estimate of predicted retinal age per class (wild type and the triple transgenic mice, WT, and 3×Tg-AD, respectively) for each age. On the left is the prediction of the network trained exclusively on WT mice, and on the right is the network trained exclusively on 3×Tg-AD mice. The median (dashed), and first and third quartiles (dotted) are shown. Figure adapted from (25). ▪ p<0.05; ● p<0.01; ★ p<0.001.

