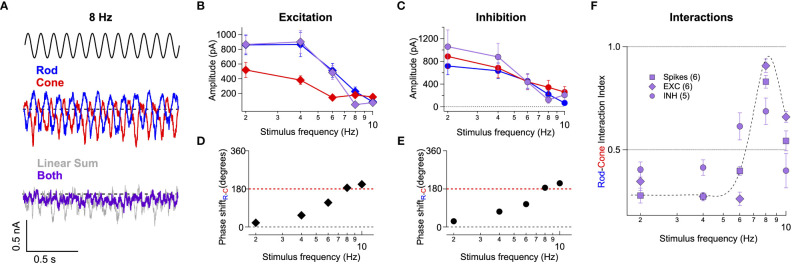
Figure 5.
Rod-cone interference is present in the excitatory and inhibitory synaptic inputs to RGCs. (A) Voltage-clamp recordings of excitatory synaptic input to an On Parasol RGC in response to 8 Hz rod (blue trace), cone (red trace), or combined (rod-cone) flicker (grey trace). (B, C) Excitatory (B) and inhibitory (C) synaptic response amplitudes (sinusoidal fit, see Methods) for stimulus frequencies ranging 2-10 Hz for 6 On Parasol RGC recordings. (D) Relative timing differences (i.e phase shifts) between isolated rod and cone excitatory inputs to On Parasol RGCs. (E) Same as in (D) but for inhibitory synaptic input. (F) Plot of the rod-cone nonlinear interaction index (see Methods) as a function of stimulus frequency. Recordings of excitatory and inhibitory synaptic input reveal a similar degree of destructive interference to that of spike recordings. Markers and error bars in B-F represents mean ± SEM.

