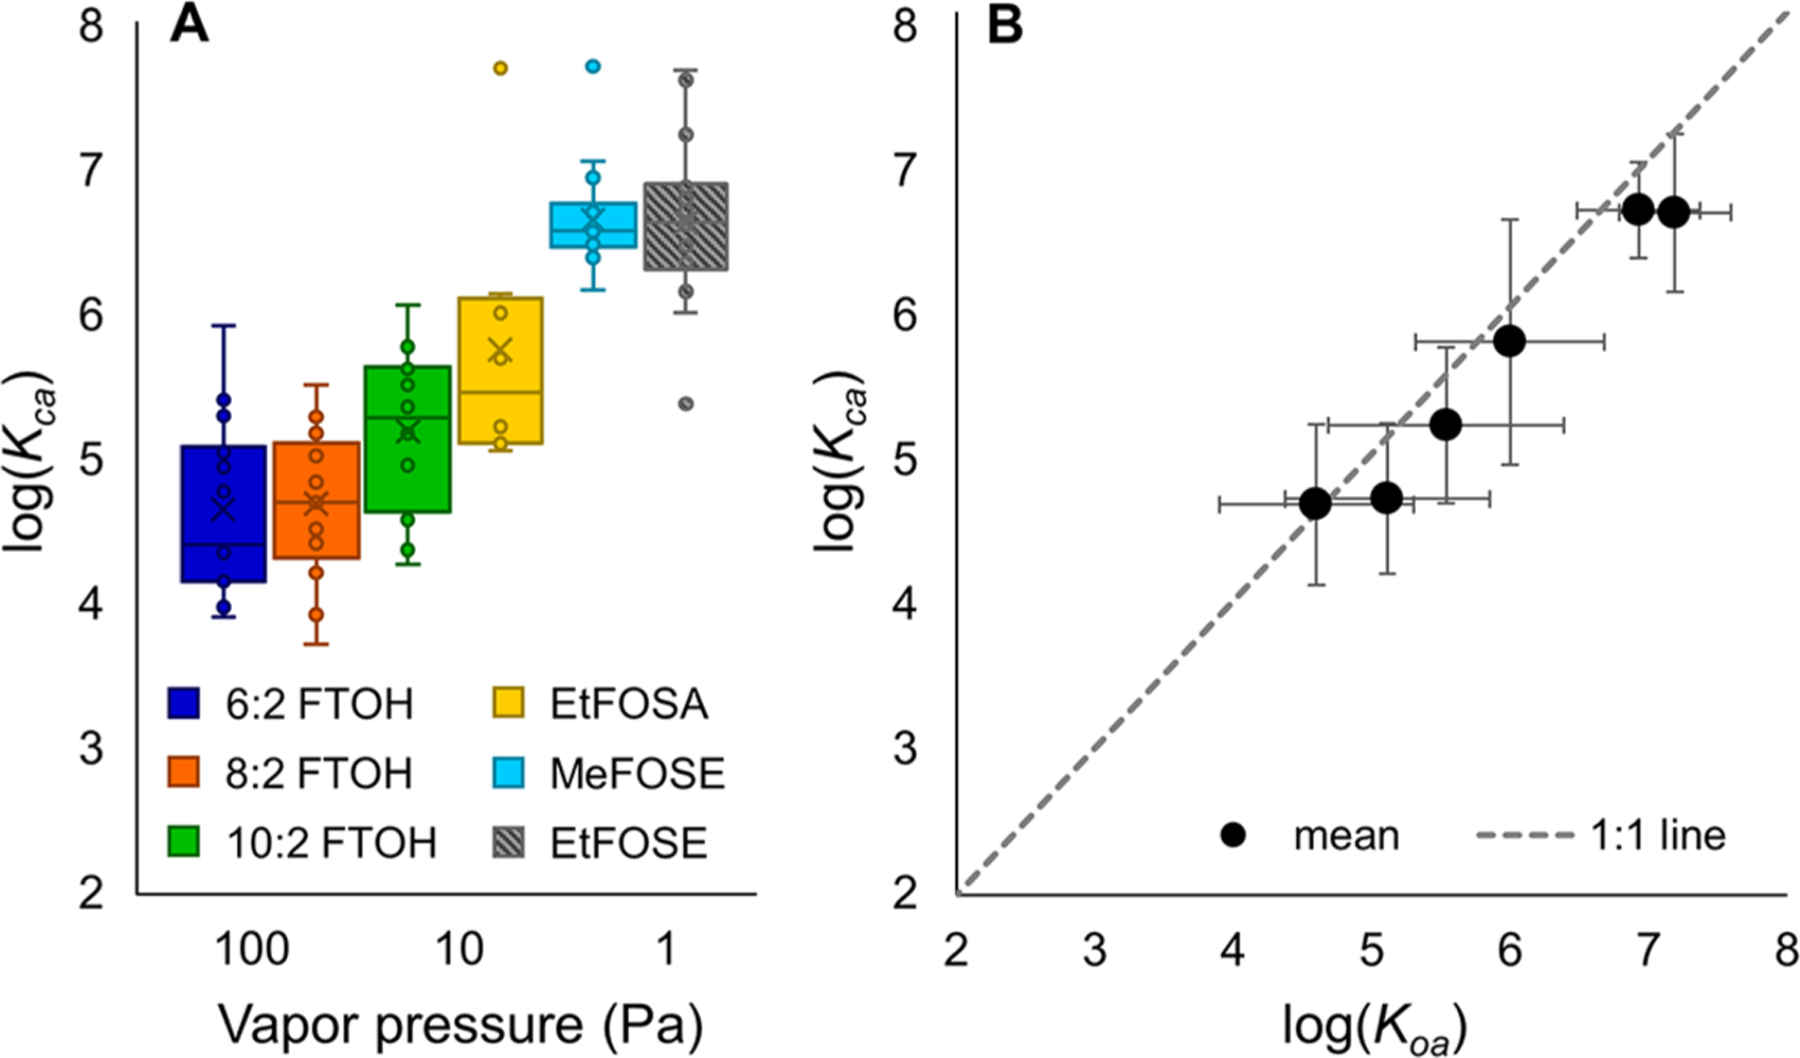
Figure 4.

(A) Boxplot showing the log(Kca) of 6:2 FTOH, 8:2 FTOH, 10:2 FTOH, EtFOSA, MeFOSE, and EtFOSE with decreasing vapor pressure. The box indicates the 25th and 75th percentiles. The line inside the box is the median. The × represents the mean, and the whiskers indicate the minimum and maximum. Points outside the range of the whiskers are considered outliers. (B) Log(Kca) based on 3-month and 6-month measurements over log(Koa) derived from measured and predicted literature values (geometric mean and standard deviation, R2 = 0.98).28,63–69
