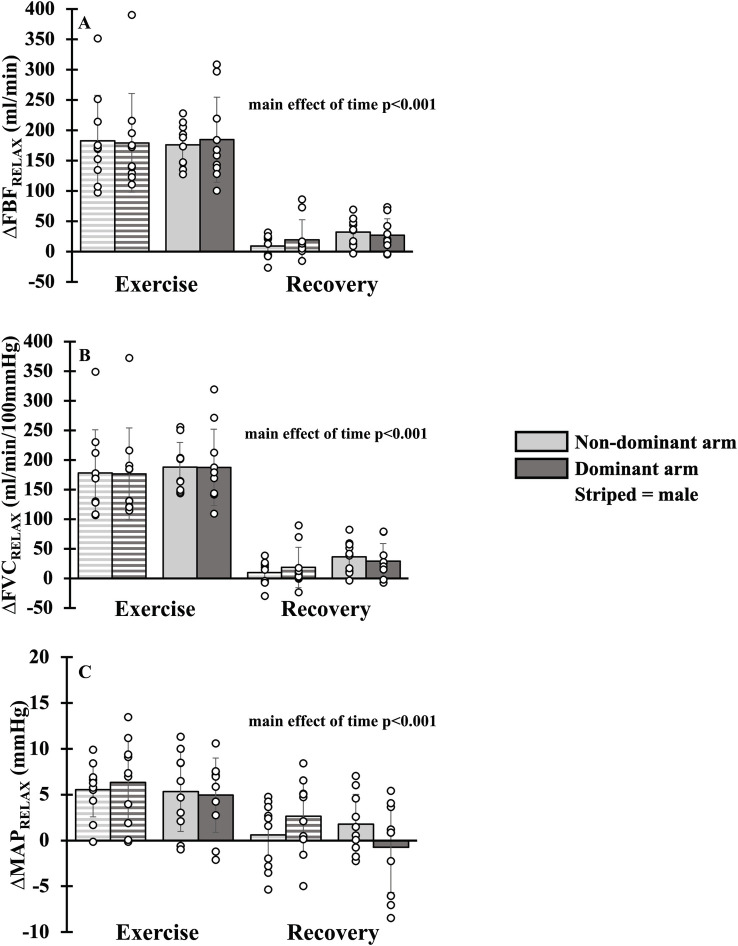
Fig 2. Hemodynamics during absolute intensity forearm exercise.
Forearm blood flow (Panel A), forearm vascular conductance (Panel B) and mean arterial blood pressure (Panel C) during exercise and recovery in dominant (dark gray bar) and non-dominant (light gray bar) arms. Data are Δ from rest. Individual responses are shown in open circles. Males are shown with striped bars.

