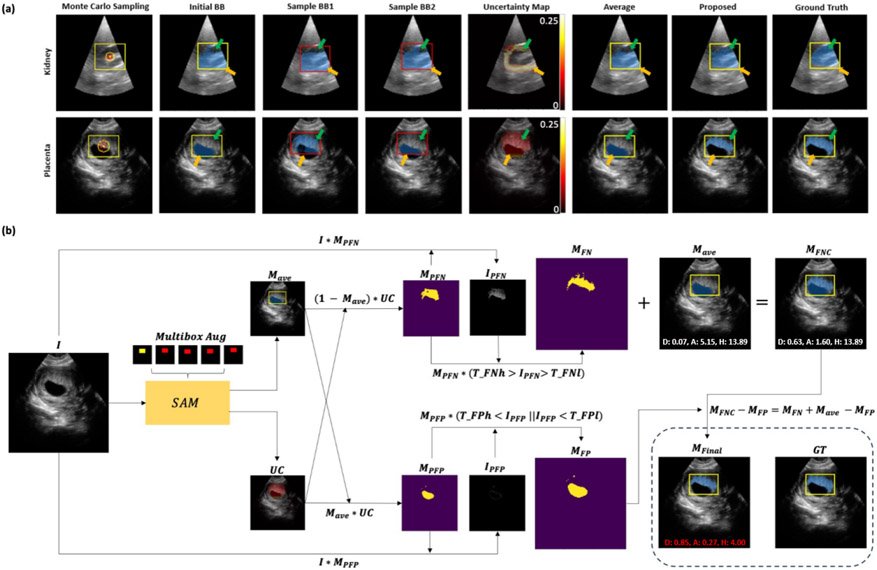
Figure 1.
(a) Monte Carlo BB sampling strategy (Sec. 2.1) on two segmentation tasks. The initial BB (yellow) has a center (yellow dot) and a sampling range (yellow circle). Sampled boxes (red) with their centers (red dots) are used to generate an average prediction. Green arrows point to FN areas in results from only the initial BB or simple averaging method, and are corrected by the proposed FNPC strategy. Orange arrows indicate areas where FPs are similarly corrected by the proposed FNPC. (b) FNPC pipeline (Sec. 2.3).

