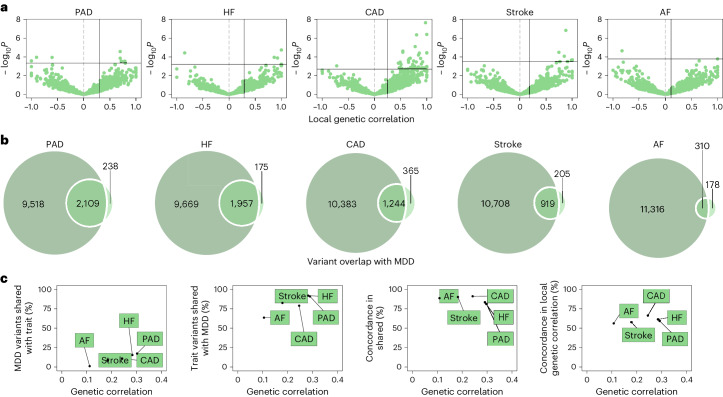
Fig. 2. Genetic overlap between MDD and CVD beyond genome-wide genetic correlation.
a, Volcano plots based on LAVA results showing genomic loci (green dots) with the local genetic correlation between MDD and each of the CVDs (x axis) and the corresponding P value (y axis). Loci exceeding the horizontal line are significant at PFDR < 0.05 (Benjamini–Hochberg-adjusted P value). Multiple testing was performed separately for each trait over all considered loci. Empirical P values were obtained via a permutation procedure with partial integration, evaluating the two-sided hypothesis of no association using the estimated parameters as test statistics. b, Venn diagrams based on MiXeR results showing the number of causal variants (number of nonzero variants required to explain 90% of trait heritability) that are unique to MDD (left circle), unique to CVD (nonoverlapping part of right circle) or shared between MDD and CVD (overlapping part of circles). c, Genetic correlation estimated by LDSC (x axis) against the percentage of MDD causal variants that are shared with the CVD trait as estimated by MiXeR (first plot), the percentage of CVD trait causal variants that are shared with MDD (second plot) and the percentage of shared variants that have concordant effect directions (third plot). The fourth plot shows the percentage of local genetic correlations from LAVA that have concordant effect directions on the y axis. In a–c, the sample sizes and information for underlying summary statistics GWASs are reported in Supplementary Table 1. AF, atrial fibrillation; CAD, coronary artery disease; HF, heart failure; PAD, peripheral artery disease.

