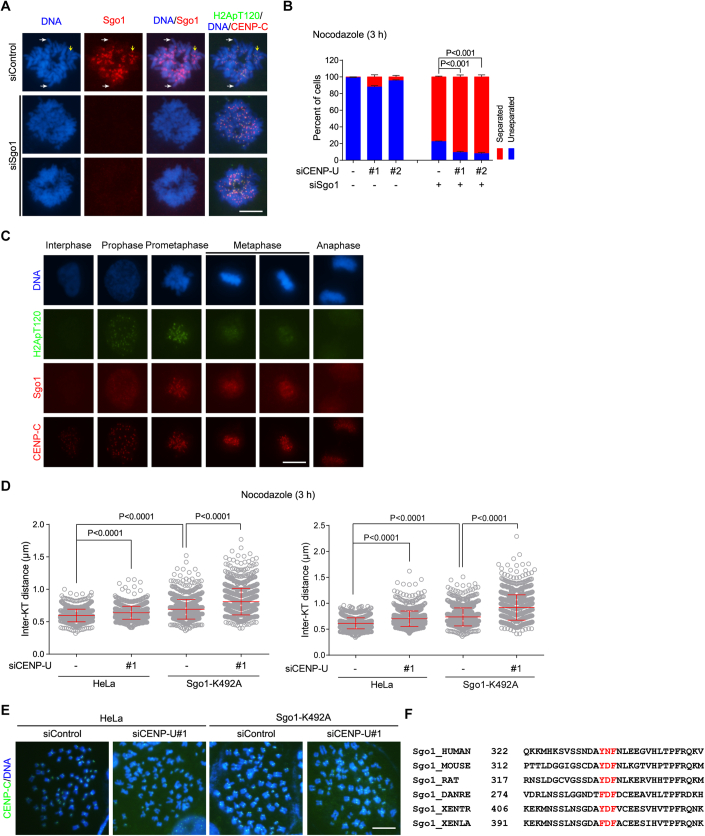
Figure EV5. CENP-U and Sgo1 additively contribute to the strength of centromeric cohesion.
(A) HeLa cells were transfected with control siRNA or Sgo1 siRNA. At 28 h post-transfection, cells were arrested in S-phase with thymidine treatment for 20 h, and then released into fresh medium. At 9 h post-release, cells were treated for 2 h with nocodazole, then mitotic cells were collected and then cytospun onto coverslips, fixed, and immunostained with antibodies for Sgo1, H2ApT120 and CENP-C, and DAPI. Example images are shown. White arrows point to Sgo1 distributed on chromosome arms. The yellow arrow points to Sgo1 enriched at mitotic centromeres. (B) HeLa cells were transfected with control siRNA, CENP-U siRNA, and/or Sgo1 siRNA. At 48h post-transfection, cells were treated with nocodazole for 3 h, then mitotic cells were collected to prepare chromosome spreads, and then stained with the CENP-C antibody and DAPI. The percentage of cells in which the majority of sister chromatids was separated or unseparated was determined in 300 cells for each condition from three independent experiments, with statistics being analyzed for cells with separated chromatids. (C) Asynchronous cells were fixed and immunostained with antibodies for Sgo1, H2ApT120, CENP-C, and DAPI. Example images for cells at the indicated stages of the cell cycle are shown. (D, E) Control HeLa cells and Sgo1-K492A mutant cells were transfected with control siRNA or CENP-U siRNA. At 48 h post-transfection, cells were subjected to nocodazole treatment for 3 h. Mitotic chromosome spreads were stained with the CENP-C antibody and DAPI. The inter-KT distance was measured on over 1000 chromosomes in 20 cells. Data from two individual experiments are shown (D). Example images are shown (E). Related to Fig. 8C. (F) Multiple sequence alignment for the Y/F-x-F motif-containing region of Sgo1 in the indicated vertebrates. Data information: Statistics were performed using unpaired Student’s t-test (B, D). Means and SDs are shown (B, D). Scale bars, 10 µm (A, C, E).

