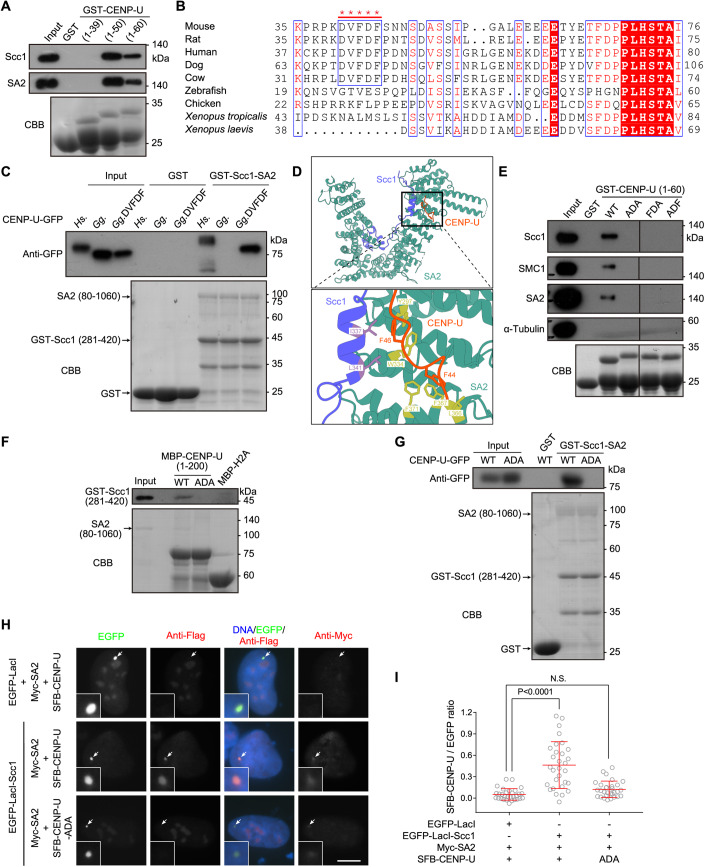
Figure 3. The FDF motif of CENP-U directly binds to the composite interface between Scc1 and SA2.
(A) HeLa cell lysates were subjected to pull-down with GST, GST-CENP-U (1–39), GST-CENP-U (1–50), or GST-CENP-U (1–60), followed by immunoblotting with antibodies for Scc1 and SA2, and CBB staining. (B) Multiple sequence alignment for the N-terminus of CENP-U. The DVFDF motif that is conserved in mammals are marked with *****. (C) Lysates prepared from HEK-293T cells transiently expressing CENP-U-GFP (human, chicken, and chimeric chicken with the DVFDF motif) were subjected to pull-down with GST or GST-Scc1 (281–420)-SA2 (80–1060), followed by immunoblotting with the antibody for GFP, and CBB staining. (D) Cartoon presentation of the overall structure of Scc1-SA2-CENP-U complex colored in purple, cyan, and orange, respectively (left), and the zoom view for binding details between F44 and F46 of CENP-U and Scc1-SA2 (right). (E) HeLa cell lysates were subjected to pull-down with GST or GST-CENP-U (1–60) in the forms of WT, ADA, FDA, and ADF, followed by immunoblotting with antibodies for Scc1, SMC1, SA2, and α-Tubulin, and CBB staining. Irrelevant lanes were removed. (F) The GST-Scc1 (281–420)-SA2 (80–1060) sub-complex was subjected to pull-down with MBP-H2A or MBP-CENP-U (1–200) in the forms of WT and ADA, followed by immunoblotting with the antibody for GST, and CBB staining. (G) Lysates prepared from HEK-293T cells transiently expressing CENP-U-GFP in the forms of WT and ADA were subjected to pull-down with GST or GST-Scc1 (281–420)-SA2 (80–1060), followed by immunoblotting with the antibody for GFP, and CBB staining. (H, I) U2OS-LacO cells transiently expressing the indicated proteins were stained with antibodies for the Flag-tag, Myc-tag, and DAPI. Example images are shown (H). The white arrows point to the LacO repeats. Scale bars, 10 µm. The fluorescence intensity ratio of SFB-CENP-U/EGFP at the LacO repeats was quantified in 30 cells for each condition, with statistics being performed using one-way ANOVA (I). Means and SDs are shown. NS no significance. Source data are available online for this figure.

