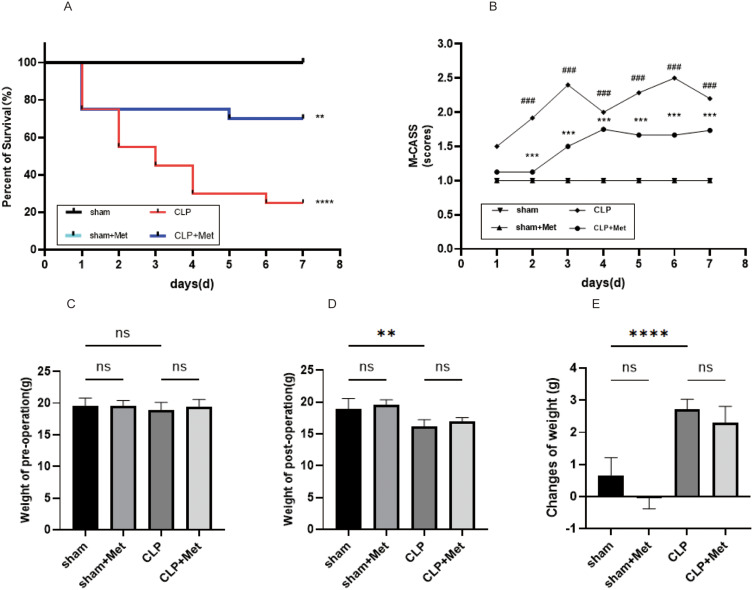
Figure 1.
The impact of metformin pre-treatment on survival state. (A) Kaplan–Meier curves for time for 7 days post-operation (n = 20). (B) The M-CASS score changes with time during the CLP-induced sepsis 7-day follow-up (mean ± S.E.M), (C–E). Changes of the weight between pre-operation and post-operation. **p<0.01, ***p<0.001, ****p<0.0001 (CLP+ Met vs CLP); ###p<0.001 (sham vs CLP).
Abbreviation: ns, non-significant.

