Fig. 1.
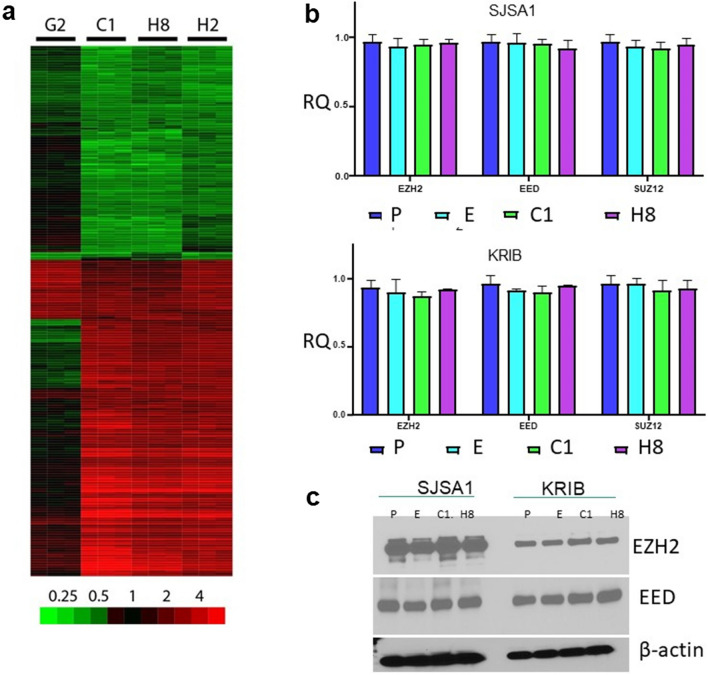
Gene expression changes after IL-11Rα knockdown or IL-11 exogenous expression in the OS cells. a, Four shRNA sequences (G2, C1, H8, and H2) targeting IL-11Rα were stably expressed in KRIB cells. Gene expression was measured by microarray. Processed and log2-transformed gene expression data were compared to that of control cells. The heat map shows subtracted values for the gene probes in which values for shRNA sequences C1, H8, and H2 differed on average by at least twofold from those in the control cells. The color bar shows the fold-change difference from the values in the control cells. b, Quantitative reverse-transcription PCR analysis of the mRNA expression levels of the PRC2 complex members EZH2, EED, and SUZ12 in SJSA1 (upper panel) and KRIB cells (lower panel). P—parental cells, E—empty vector, C1—IL-11Rα knockdown via shRNA C1, H8—IL-11Rα knockdown via shRNA H8, RQ—relative quantity. c Immunoblot of EZH2 and EED protein levels in SJSA1 and KRIB cells. β-actin served as a loading control. P—parental cells, E—empty vector, C1—IL-11Rα knockdown via shRNA C1, H8—IL-11Rα knockdown via shRNA H8, RQ—relative quantity.

