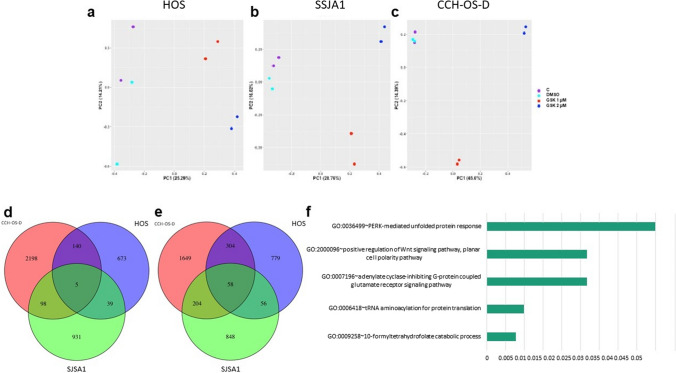
Fig. 6 .
RNA sequencing of OS cells treated with GSK126. a-c Principal component analysis of RNA expression levels of genes for GSK126-sensitive cell lines HOS and SJSA1 (a and b) and the GSK126-resistant cell line CCH-OS-D c. subjected to no treatment (control, C), treatment with dimethyl sulfoxide (DMSO, vehicle), or treatment with GSK126 at 1 or 2 µM. d and e Venn diagrams showing the intersection of significantly upregulated and downregulated genes (upon GSK126 treatment, both 1 or 2 µM, as compared to control and DMSO) of the 3 cell lines. f Bar plot of the Gene Ontology enriched pathways

