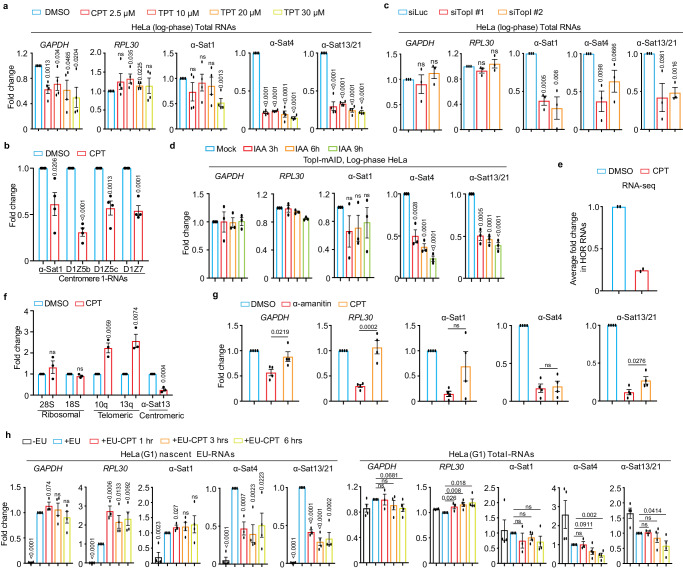
Fig. 1. TopI is for α-satellite transcription in human cells.
a TopI inhibition decreases α-SatRNA levels. RNAs from HeLa cells treated with DMSO, CPT or TPT for 12 h were subjected for real-time PCR analysis. n = 4 biological replicates. b Effects of TopI inhibition on the transcription on different centromere 1 regions. RNAs from HeLa cells treated with DMSO or CPT (2.5 µM) and RNAs were subjected to real-time PCR analysis. n = 4 biological replicates. c TopI knockdown decreases α-SatRNA levels. HeLa cells were transfected with Luciferase or Top1 siRNAs (#1 and #2) and RNAs were extracted for real-time PCR analysis. n = 3 biological replicates. d IAA-induced TopI-mAID degradation decreases α-SatRNA levels. HeLa cells of TopI-mAID constructed by CRSPR/Cas9 were treated with IAA (1 µM) and RNAs were extracted for real-time PCR analysis. n = 3 biological replicates. e TopI inhibition globally decreases the levels of α-satellite high-order repeat (HOR) RNAs. HeLa cells treated with DMSO or CPT (2.5 µM) for 12 h and RNAs were extracted for RNA-Seq analysis. Average fold change for the transcript of each HOR upon CPT treatment is shown here. n = 2 biological replicates. f TopI inhibition does not decrease the transcription of telomeric and ribosomal repeats. RNAs from HeLa cells treated with DMSO or CPT (2.5 µM) for 12 h and were subjected to real-time PCR analysis. n = 3 biological replicates. g Comparison for the effects of TopI inhibition and RNAP II inhibition on α-satellite transcription. HeLa cells were treated with DMSO, α-amanitin (50 µg/ml) and CPT (2.5 µM) for 12 h, and RNAs were extracted for real-time PCR analysis. n = 4 biological replicates. h TopI inhibition represses transcriptional activity on α-satellite in G1 cells. Thymidine-arrested G1 HeLa cells were treated with DMSO or CPT (2.5 µM) and 5′-ethynyl uridine (EU) was added 1 h before harvest. Biological replicates (n = 3 for 1 h and n = 4 for others). All data here are presented as mean values +/− SEM. Two-sided Student’s T-test (a–d, f, h) and ANOVA followed by pairwise comparisons using Tukey’s test for (e). Quantification details for all figures are recorded in the Methods. ns, not significant (P > 0.1). Numeric values for P < 0.1 are shown. Source data are provided as Source Data file.

