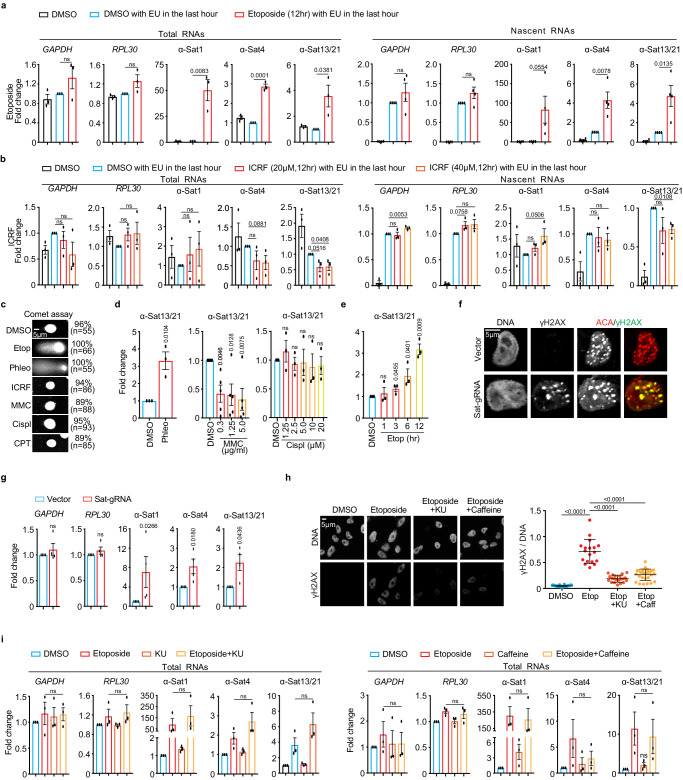
Fig. 3. Double-stranded breaks (DSBs) dramatically increase α-satellite transcription in a DNA damage checkpoint-independent manner in human cells.
a, b Etoposide, not ICRF, dramatically increases the levels of total and nascent α-satRNAs. Total and EU-labelled RNAs from HeLa cells treated with DMSO, etoposide (30 μM), or ICRF (20 or 40 μM), were subjected to real-time PCR analysis. Biological replicates (n = 4 for nascent in (a) and n = 3 for the others). c DSB analysis by comet assay. HeLa cells treated with DMSO, Etoposide (Etop, 30 μM), Phleomycin (Phleo, 80 μg/ml), ICRF (20 μM), MMC (5 μg/ml), Cisplatin (Cispl, 20 μg/ml), or CPT (2.5 μM) for 12 h, were analyzed with comet assay. Similar results were observed in two biological replicates. d DSB-inducing agents increase α-satellite transcription. RNAs from HeLa cells treated with DMSO, Phleo (80 μg/ml, 24 h), MMC (indicated, 12 h), or Cispl (indicated, 12 h) were analyzed with real-time PCR. Results for other primers are recorded in Figs. S6d-f. Biological replates (n = 5 for MMC and n = 3 for others). e Etoposide increases α-satellite transcription in a time-dependent manner. RNAs from HeLa cells treated with DMSO or etoposide (2.5 μM) as indicated were analyzed with real-time PCR. Results for other primers are recorded in Fig. S6g. n = 3 biological replicates. f CRISPR-Cas9 generates DSBs specifically on the centromere. Sat-gRNA plasmids were transfected into HeLa cells for 24 h and immunostaining was performed. ~16% of cells had centromeric γH2AX foci. g DSBs generated by CRISPR-Cas9 increase α-satellite transcription. RNAs in (e) were subjected to real-time PCR analysis. n = 4 biological replicates. h ATM inhibition decrease etoposide- induced γH2AX levels. HeLa cells were treated with DMSO, etoposide (30 μM), etoposide plus KU-55933 (10 μM), or etoposide plus caffeine (2 μM) for 12 h and then stained with the indicated antibodies. Similar results were observed in two biological repeats. Quantification was based on one single experiment. Each dot represents one cell. DMSO n = 32, Etop n = 18, Etop+Ku n = 21, Etop+Caff n = 27. i ATM inhibition does not affect etoposide-induced α-satellite transcription. RNAs in (h) were analyzed with real-time PCR. n = 3 biological replicates. All data here are presented as mean values +/− SEM expect for (h, +/− SD). Two-sided Student’s T-test (a, b, d, e, g) and ANOVA followed by pairwise comparisons using Tukey’s test for (h, i). ns, not significant (P > 0.1). Numeric values for P < 0.1 are shown. Source data are provided as Source Data file.

