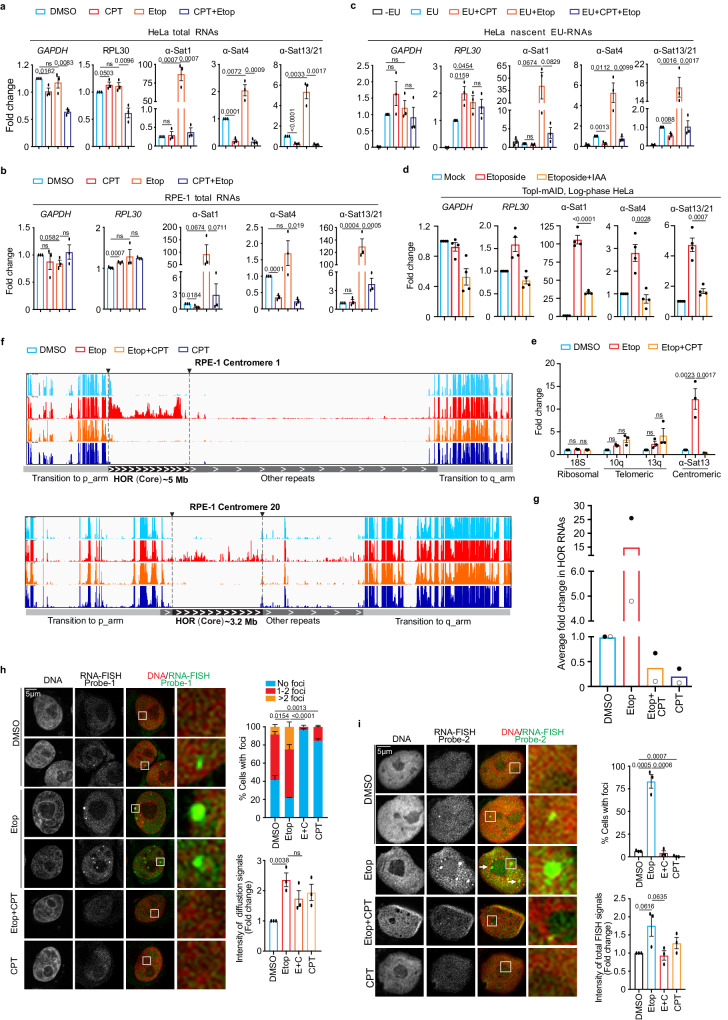
Fig. 4. DSB-induced α-satellite transcription depends on TopI and induced RNAs are predominantly derived from α-satellite high-order-repeats (HORs) and spread across the nucleus.
a TopI inhibition dramatically decreases total α-SatRNA levels in etoposide-treated HeLa cells. RNAs from HeLa cells treated with DMSO, CPT (2.5 μM), Etoposide (Etop, 30 μM), or CPT plus Etoposide for 12 h were subjected to real-time PCR analysis. n = 3 biological replicates. b TopI inhibition dramatically reduces total α-SatRNA levels in etoposide-treated RPE-1 cells. RNAs from RPE-1 cells treated with DMSO, CPT (2.5 μM), Etoposide (30 μM), or Etoposide plus CPT (E + C) for 12 h were subjected to real-time PCR analysis. n = 3 biological replicates. c TopI inhibition abates the transcriptional activity in both unperturbed and etoposide-treated HeLa cells. HeLa cells were treated with DMSO, CPT (2.5 μM), Etoposide (Etop, 30 μM), or Etoposide plus CPT for 12 h and EU was added 1 h before harvest. EU-RNAs were purified for real-time PCR analysis. n = 3 biological replicates. d IAA-induced TopI-mAID degradation decreases etoposide-induced α-SatRNA levels. HeLa cells of TopI-mAID were treated with IAA (1 μM) and etoposide. RNAs were extracted for real-time PCR analysis. n = 4 biological replicates. e TopI is not required for the transcription of ribosomal and telomeric repeats in etoposide-treated cells. RNAs from HeLa cells treated with DMSO, Etoposide (Etop, 30 μM), or Etoposide plus CPT (2.5 μM) for 12 h, were subjected to real-time PCR analysis. n = 3 biological replicates. f RNA-seq analyses of α-satRNAs. RNAs from RPE-1 cells treated with DMSO, CPT (2.5 μM), Etoposide (Etop, 30 μM), or CPT plus etoposide for 12 h, were subjected to RNA-Seq analysis. g TopI inhibition globally decreases the levels of α-satellite high-order repeat (HOR) RNAs. Average fold change for HOR transcripts upon chemical treatment in (f) is shown. n = 2 biological replicates. h, i Fluorescence in situ hybridization analysis of α-satRNAs. HeLa cells were treated with DMSO, CPT (2.5 μM), Etoposide (Etop, 30 μM), or etoposide plus CPT for 12 h and then subjected to RNA-FISH analysis using probe-1 (h) and probe-2 (i). Arrows in (i) indicate the inside or outside localization of t α-satRNA foci. n = 3 biological replicates. All Data here are presented as mean values with +/− SEM. Two-sided Student’s T-test for (a–d, h, i) and ANOVA followed by pairwise comparisons using Tukey’s test for (e). ns, not significant (P > 0.1). Numeric values for P < 0.1 are shown. Source data are provided as Source Data file.

