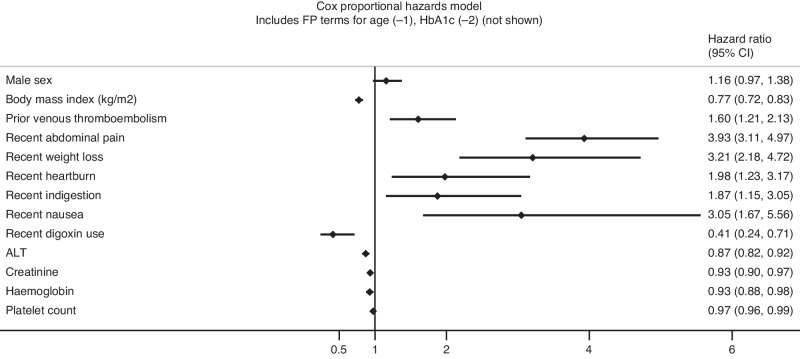
Fig. 1. Forest plot demonstrating the final Cox proportional hazards model as its exponentiated coefficients (hazard ratios, with 95% confidence intervals).
The full model including the baseline survival term is detailed in the supplement. The term for jaundice is not plotted due to the magnitude of the hazard ratio affecting visualisation on similar scale as the other predictors. The hazard ratios for body mass index correspond to a per-5 unit increase, whereas the hazard ratios for ALT, creatinine, haemoglobin and platelet count correspond to a per-10 unit increase.

