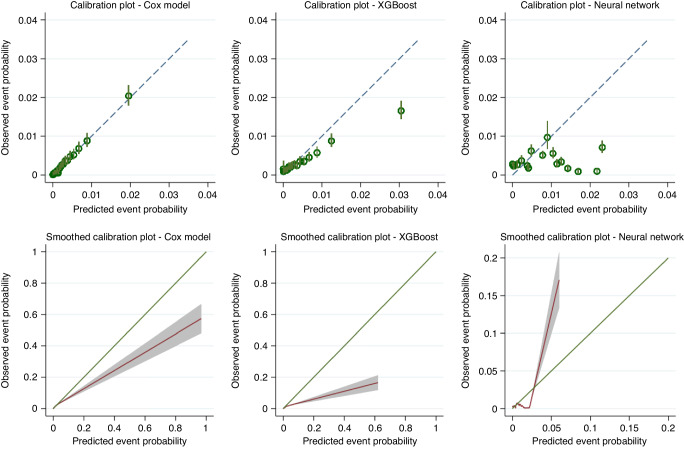
Fig. 3. Calibration plots demonstrating the alignment between predicted and observed risks for each model using two approaches: top row = grouped by 20th of predicted risk; bottom row = smoothed plots generated by plotting a running smoother through predicted values and observed pseudo-observations for the Kaplan-Meier failure probability at 2 years.
Predicted probabilities are those generated during internal–external cross-validation.

