Figure 10.

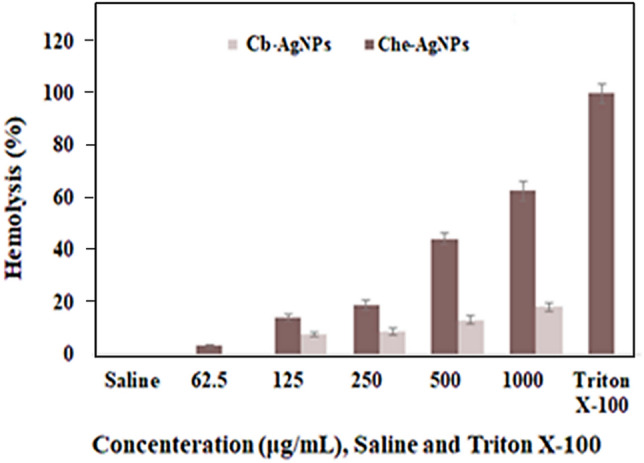
Diagram of hemolysis percentage, Normal saline as a negative control (1), Triton X-100 as a positive control (2), and Cb-AgNPs and Che-AgNPs at different concentrations of 25 (3), 50 (4), 125 (5), 250 (6), and 500 (7) μg/mL.

Diagram of hemolysis percentage, Normal saline as a negative control (1), Triton X-100 as a positive control (2), and Cb-AgNPs and Che-AgNPs at different concentrations of 25 (3), 50 (4), 125 (5), 250 (6), and 500 (7) μg/mL.