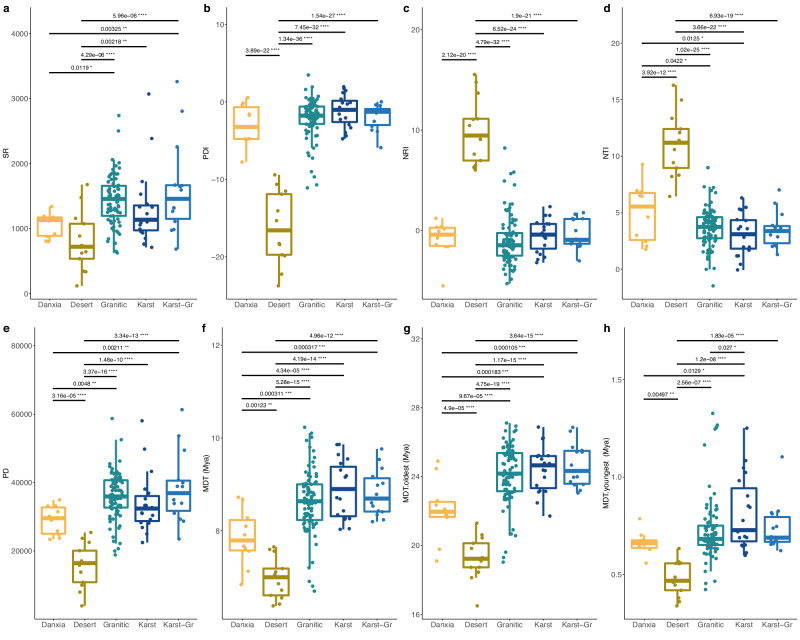
Fig. 3. Differences in species richness, phylogenetic diversity, phylogenetic structure, and age of floras among different landforms.
a species richness (SR); b phylogenetic diversity index (PDI); c net relatedness index (NRI); d nearest taxon index (NTI); e phylogenetic diversity (PD); f mean diversity time of all species (MDT); g mean divergence time of the oldest 25% of species (MDT.oldest); h mean divergence time of the youngest 25% of species (MDT.youngest). Karst-Gr, karst-granitic. The colors on the x-axis indicate different types of landforms. The sample sizes (n) for Danxia, Desert, Granitic, Karst, Karst-Gr are 10, 13, 84, 19 and 14, respectively. The box plots show the first and third quartiles (box limits), median (center line), and whiskers extend to a maximum of 1.5 times the interquartile range. Differences between each pair of landforms determined by using a two-sided, independent samples t test and P-values shown above the black line. ****P < 0.00001; ***P < 0.0001; **P < 0.001; *P < 0.05. Source data are provided as a Source Data file.

