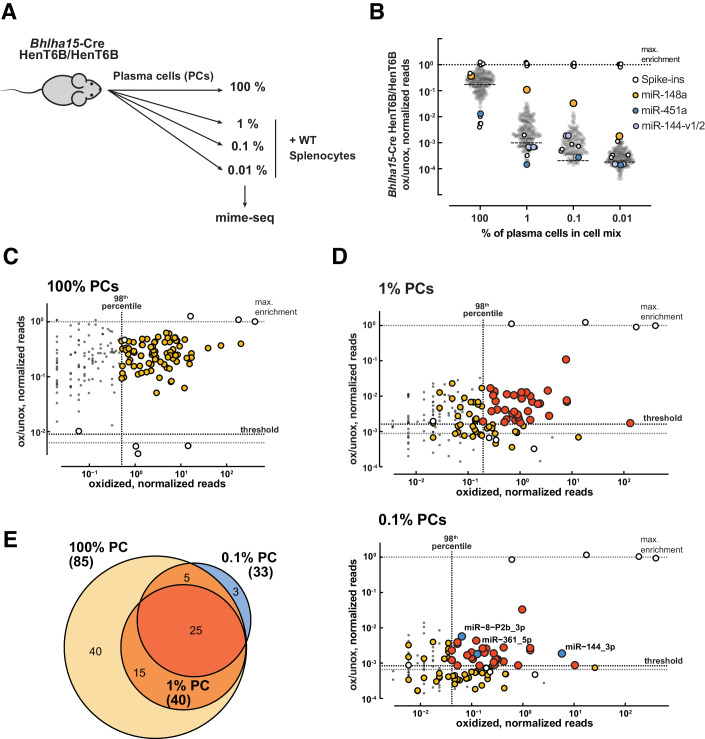
Figure 4. HENMT1ΔC-T6B mime-seq recovers cell-specific miRNAs in vivo.
(A) Schematic overview of the mixing experiment to test the sensitivity of mime-seq. Plasma cells (PCs) were isolated from the spleen of immunized Bhlha15-Cre R26HenT6B/HenT6B mice by flow-cytometric sorting (Fig. EV4A) and were then mixed at the indicated ratios with total splenocytes of wild-type (WT) C57BL/6 mice. Mime-seq was performed with the different cell mixes. (B) Total RNA extracted from Bhlha15-Cre R26LSL-HenT6B/ LSL-HenT6B PCs mixed at indicated ratios with B6 splenocytes. A mix of methylated and unmethylated spike-ins was added and small RNA sequencing libraries prepared from RNA with or without prior oxidation. Reads are normalized to methylated spike-ins. Shown are fractions recovered for all sequenced miRNAs with normalized reads >0.5. Median level of methylation for every genotype is shown as lines with 95% CI. N = 295 miRNAs per timepoint. Sequencing libraries were prepared from one biological replicate. (C, D) Identification of miRNAs confidently expressed in PCs. Black dotted lines indicate the thresholds use to define miRNAs expressed in PCs. We used an abundance cutoff (vertical line) for miRNAs that are in the top 98th percentile of cumulative reads, and an enrichment after oxidation cutoff (horizontal line) calculated as the average + standard deviation of the ox/unox ratio of the four unmethylated spike-ins. Shown are fractions recovered for all sequenced miRNAs with normalized reads >0.5 (PC mixing ratios indicated above). Reads originating from isomiRs are summed. (C) miRNAs identified in 100% PC (yellow). (D) miRNAs identified in 1% or 0.1% PC (orange). False positives (blue) are defined as miRNAs that pass the set thresholds but are not identified in the 98th top percentile of the 100% PC sample. (E) Venn-diagram showing overlap between different samples. Colors as described above.

