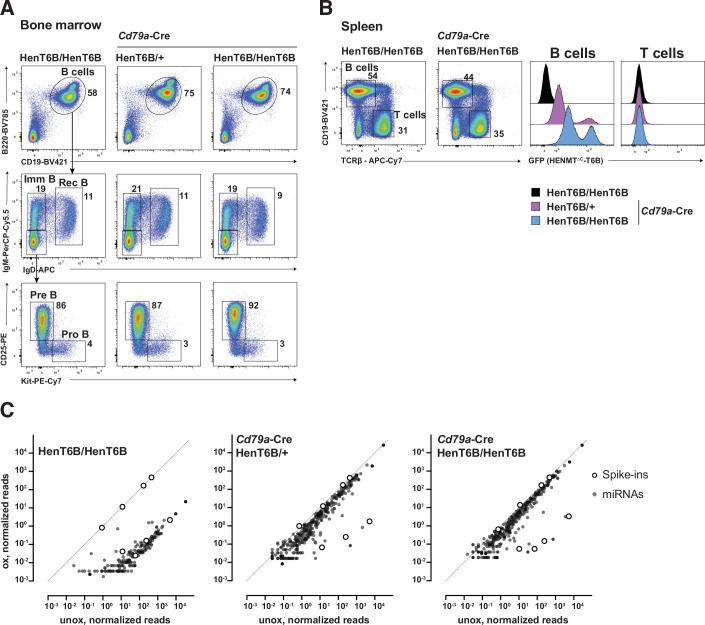
Figure EV3. Analysis of B cell development in Cd79a-Cre R26LSL-HenT6B/LSL-HenT6B mice.
(A) Flow-cytometric analyses of the indicated B cell types in the bone marrow of Cd79a-Cre R26LSL-HenT6B/+, Cd79a-Cre R26LSL-HenT6B/LSL-HenT6B and control R26LSL-HenT6B/LSL-HenT6B mice at the age of 6–8 weeks. The percentage of cells in the indicated gates is shown. One of three independent experiments is shown. (B) Flow-cytometric analysis of B and T cells in the spleen of Cd79a-Cre R26LSL-HenT6B/+, Cd79a-Cre R26LSL-HenT6B/LSL-HenT6B and control R26LSL-HenT6B/+ or R26LSL-HenT6B/LSL-HenT6B mice at the age of 6–8 weeks. The percentage of B and T cells is shown next to the respective gate (left). The GFP expression of B and T cell of the indicated genotypes is shown as a histogram (right). One of three independent experiments is shown. (C) Total RNA was extracted from B cells of the indicated genotypes (see Methods for purification strategy), mixed with four methylated and four unmethylated RNA spike-ins and subjected to mime-seq. Libraries were normalized to methylated spike-ins. Normalized reads of oxidized vs. unoxidized libraries are plotted for every miRNA with > 0.5 norm. reads. Note the depletion of unmethylated miRNAs (similar to the four unmethylated spike-ins) and the strong enrichment when HENMT1∆C-T6B is expressed (close to the four methylated spike-ins).

