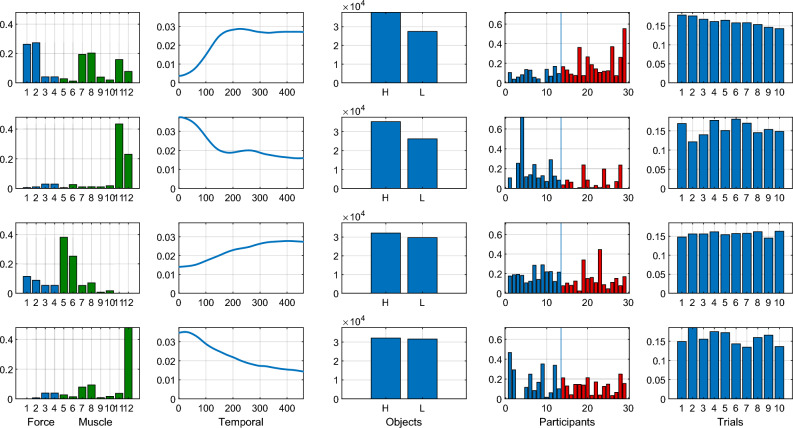
Figure 4.
The estimated factors for the 5-way tensor with components (in rows). The first column shows the decomposition of the spatial mode () into different components, where the forces and muscles are color coded (blue and green, respectively) for improved visualization. Indexing of forces and muscles is done as described in Table 1. The second column shows the four temporal () components and the third column shows the estimated object () factors. The fourth column shows the participant () factors, and the vertical line indicates the boundary of the young group (YA, left hand side, blue) and old group (OA, right hand side, red). The last column shows the four trial () components. Throughout, the magnitudes represent how much each variable (or trial) contributes to each component.

