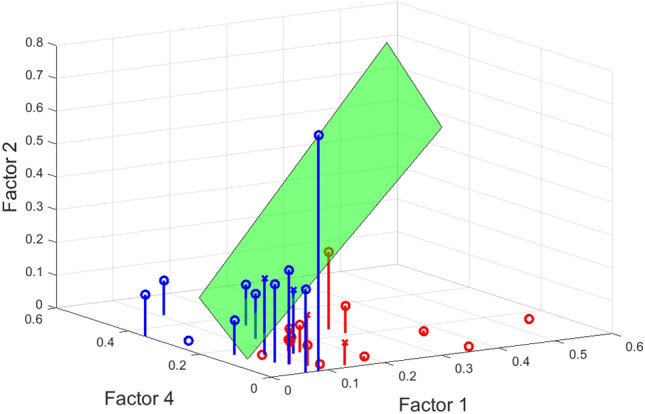
Figure 5.

Age group (i.e. YA vs OA) classification using the first three participant-mode factors ( and ) of the 5-way tensor as predictors. The green plane indicates the decision boundary of the linear classifier. The stem plots help visualize the points that lie on the different half-spaces defined by the decision boundary, and hence are assigned different predicted labels by the classification rule. Indeed, blue and red stand for the predicted labels (blue for YA, red for OA). The circle and cross indicate whether the prediction is correct (circle for correct prediction, cross for wrong prediction). The AUC and classification accuracy are 0.83 and 0.79, respectively.
