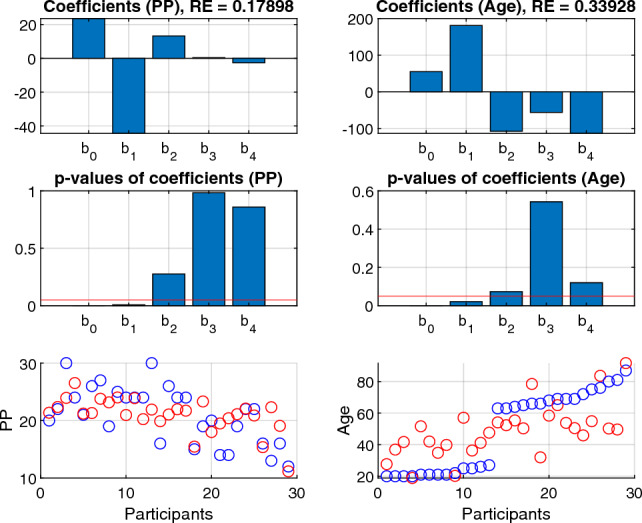
Figure 6.

Results of linear regression using the participant modes of the 5-way model as predictors and PP or age as response. The first row shows the regression coefficients, where is the intercept and are the regression coefficients for the corresponding participant factors. The second row shows the p-value of the regression coefficients, with the red line indicating significant level 0.05. The third row shows the true and predicted PP (left) or age (right) for different participants. The blue and red points stand for the true and predicted values of PP and age, respectively.
