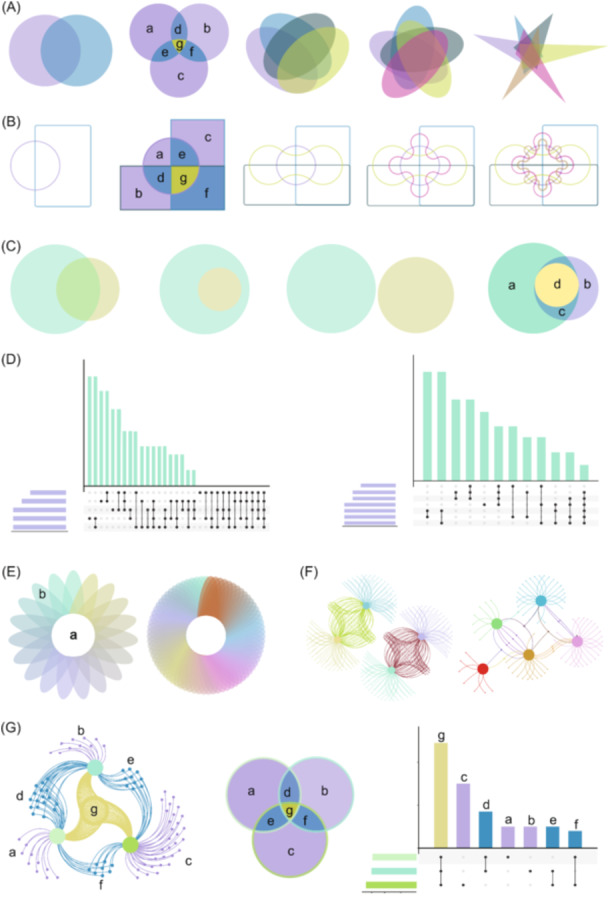
Figure 1.

Representative result diagrams in EVenn. (A) Interactive Standard Venn diagrams for two to six sets. (B) Interactive Edwards diagrams for two to six sets. (C) Euler diagrams for two to three sets. (D) UpSet plot displaying empty intersections of five sets and nonempty intersections of seven sets. (E) Flower plot for 19 sets and 70 sets. (F) Venn network diagrams for four to five sets. (G) Interrelation among Venn diagram, UpSet plot, and Venn network.
