Figure 2.

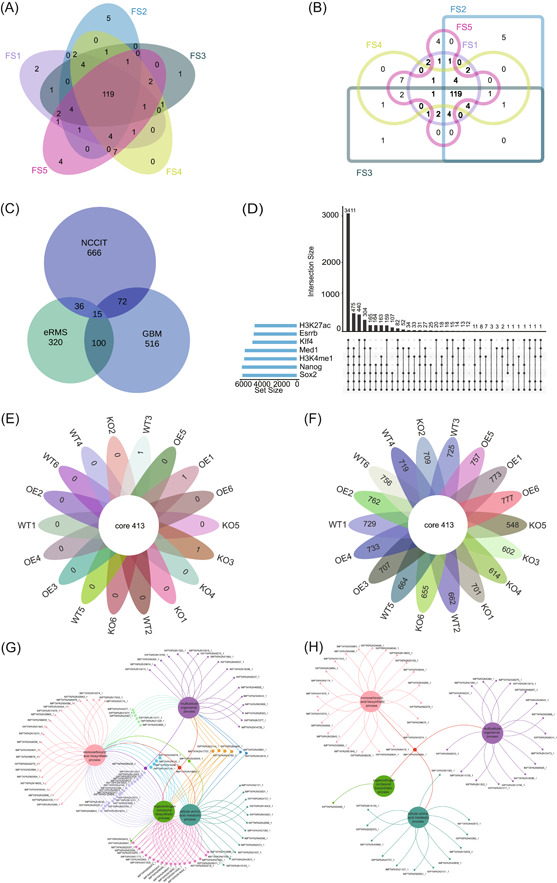
Case demonstrations in EVenn. (A) Interactive Venn diagrams for differential metabolites of five parts of Poria cocos. (B) Interactive Edwards diagrams for differential metabolites of five parts of Poria cocos. (C) Euler diagrams for differentially expressed genes in three cell types following anticancer drug treatment. (D) UpSet plot for seven transcription regulators and their targeting genes in ChIP‐seq. (E) Interactive flower plot displaying 18 groups of common and unique elements of OTUs. (F) Interactive flower plot showcasing OTUs of common and after subtracting common elements in 18 groups. (G) Venn network diagrams for visualizing gene ontology enrichment analysis results for Andrographis paniculata. (H) Venn network diagram exclusively showcasing common and unique genes of four biological processes of Andrographis paniculata.
