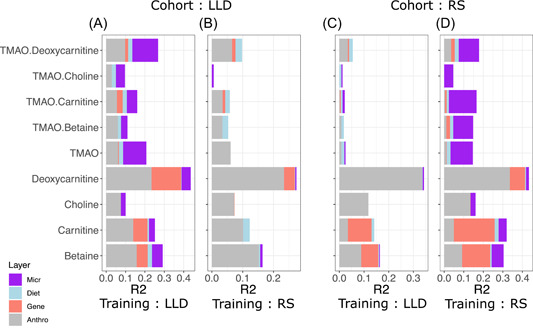
Figure 2.

Variance explained in gut microbiome‐related metabolite levels and ratios by different data layers. The X‐axis shows the coefficient of determinations R 2 gained with each additional data layer (gray ‐ anthropometrics; red ‐ genetics; blue ‐ diet; purple ‐ microbiome). Two models were trained, using LLD (A and C) or Rotterdam Study III‐2 (named RS) (B and D) as the train set, and the left‐out cohort as the test set respectively.
