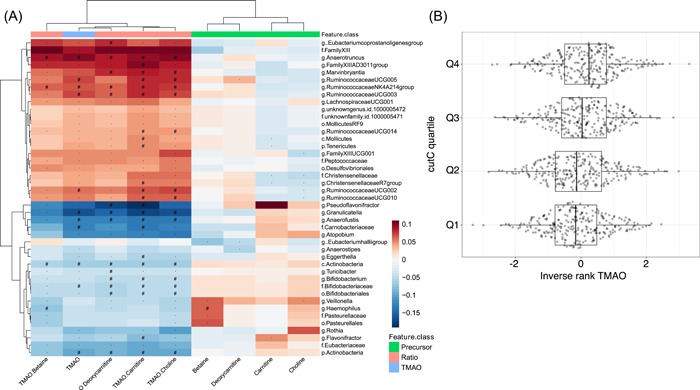
Figure 4.

Microbial associations with plasma metabolic concentrations (A) Heatmap showing results of the association analysis between metabolites and gut microbial taxa. Displayed results are after adjustment for age, sex, BMI, and study‐specific covariates. Metabolites are displayed on the x‐axis and gut microbial taxa are shown on the y‐axis. Red color denotes positive associations and blue color stands for negative associations. Hash symbol (#) represents the Bonferroni significant associations (p value < 6.2 × 10⁻⁵), while star denotes suggestive associations (p value < 1.2 × 10⁻³). (B) Boxplots displaying the distribution of normalized TMAO concentration per clr‐transformed abundance quartiles from cutC, measured from metagenomic shotgun sequencing in LLD.
